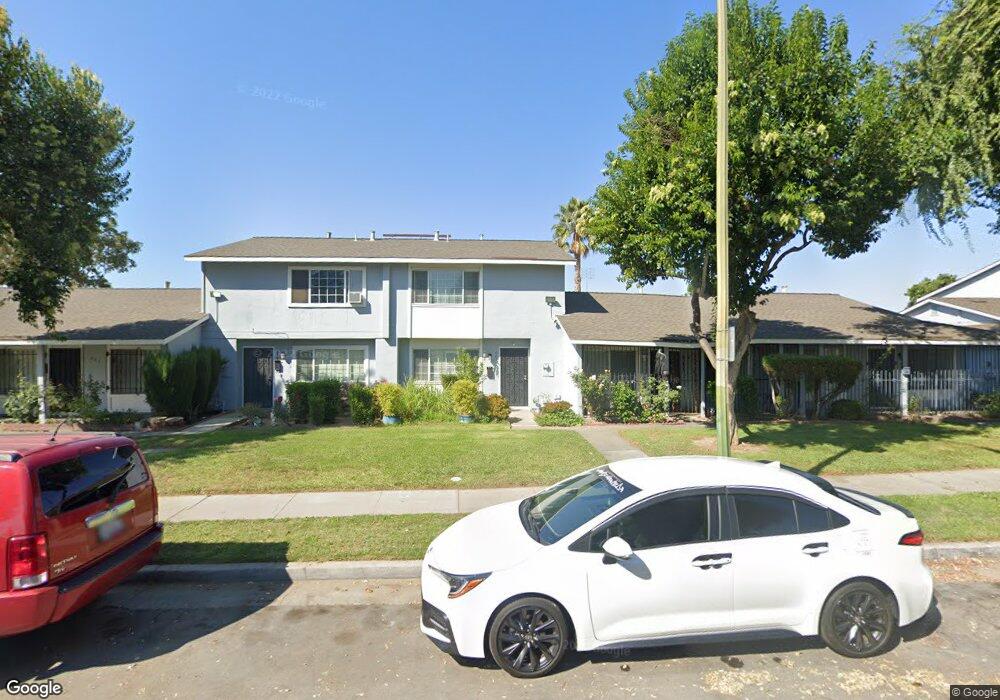
471 Laufall Ln San Jose, CA 95111
Hellyer NeighborhoodEstimated Value: $497,182 - $542,000
2
Beds
2
Baths
921
Sq Ft
$568/Sq Ft
Est. Value
About This Home
This home is located at 471 Laufall Ln, San Jose, CA 95111 and is currently estimated at $523,296, approximately $568 per square foot. 471 Laufall Ln is a home located in Santa Clara County with nearby schools including Los Arboles Literacy And Technology Academy, Sylvandale Middle School, and Lairon College Preparatory Academy.
Ownership History
Date
Name
Owned For
Owner Type
Purchase Details
Closed on
Feb 22, 2004
Sold by
Bola Harbans Singh and Bola Jasbir Kaur
Bought by
Bola Harbans Singh and Bola Jasbir Kaur
Current Estimated Value
Purchase Details
Closed on
Sep 17, 2002
Sold by
Bola Harbans Singh and Bola Jasbir Kaur
Bought by
Bola Harbans Singh and Bola Jasbir Kaur
Home Financials for this Owner
Home Financials are based on the most recent Mortgage that was taken out on this home.
Original Mortgage
$60,000
Interest Rate
6.24%
Create a Home Valuation Report for This Property
The Home Valuation Report is an in-depth analysis detailing your home's value as well as a comparison with similar homes in the area
Home Values in the Area
Average Home Value in this Area
Purchase History
| Date | Buyer | Sale Price | Title Company |
|---|---|---|---|
| Bola Harbans Singh | -- | -- | |
| Bola Harbans Singh | -- | Fidelity National Title Ins |
Source: Public Records
Mortgage History
| Date | Status | Borrower | Loan Amount |
|---|---|---|---|
| Closed | Bola Harbans Singh | $60,000 |
Source: Public Records
Tax History
| Year | Tax Paid | Tax Assessment Tax Assessment Total Assessment is a certain percentage of the fair market value that is determined by local assessors to be the total taxable value of land and additions on the property. | Land | Improvement |
|---|---|---|---|---|
| 2025 | $3,545 | $154,498 | $55,173 | $99,325 |
| 2024 | $3,545 | $151,470 | $54,092 | $97,378 |
| 2023 | $3,459 | $148,501 | $53,032 | $95,469 |
| 2022 | $3,395 | $145,591 | $51,993 | $93,598 |
| 2021 | $3,316 | $142,737 | $50,974 | $91,763 |
| 2020 | $3,126 | $141,275 | $50,452 | $90,823 |
| 2019 | $2,995 | $138,506 | $49,463 | $89,043 |
| 2018 | $2,967 | $135,792 | $48,494 | $87,298 |
| 2017 | $2,921 | $133,131 | $47,544 | $85,587 |
| 2016 | $2,779 | $130,521 | $46,612 | $83,909 |
| 2015 | $2,721 | $128,561 | $45,912 | $82,649 |
| 2014 | $2,294 | $126,044 | $45,013 | $81,031 |
Source: Public Records
Map
Nearby Homes
- 3137 Shofner Place
- 523 Sieber Place
- 582 Palmetto Dr
- 540 Groth Place
- 570 Crabapple Way
- 563 Groth Place
- 3819 7 Trees Blvd Unit 303
- 205 Kenbrook Cir
- 3281 Lantern Way
- 383 Southside Dr
- 84 Rancho Dr Unit H
- 3234 Kenhill Dr
- 200 Southside Dr
- 4016 San Bernardino Way
- 727 Pinto Dr
- 340 Kenbrook Cir
- 734 Overland Way
- 3105 Kenland Dr
- 397 Kenbrook Cir
- 403 Kenbrook Cir
Your Personal Tour Guide
Ask me questions while you tour the home.