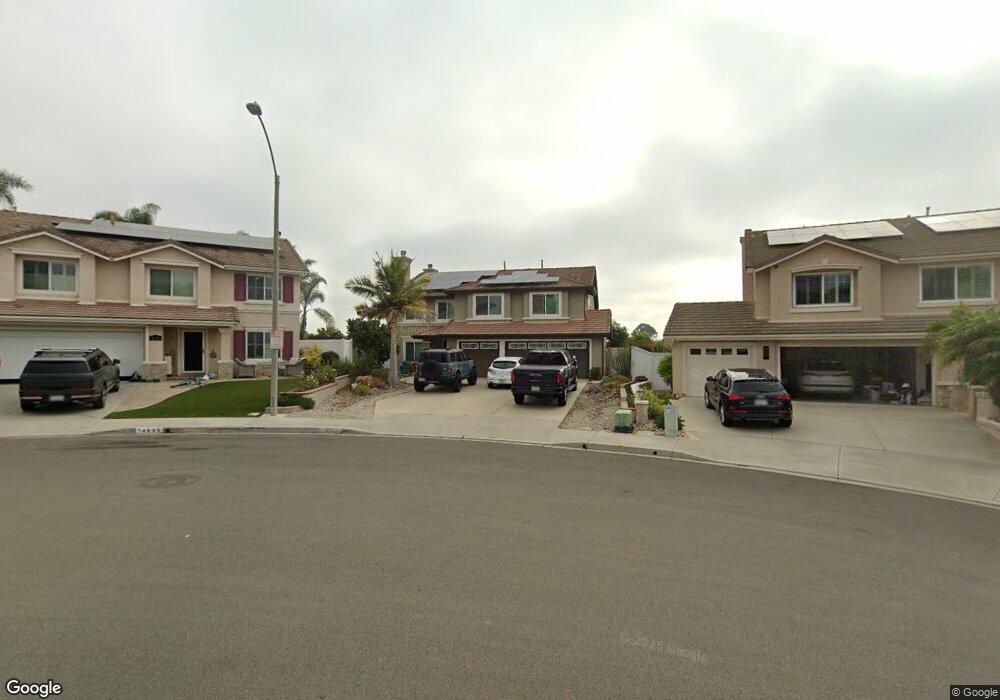
471 Lexington Cir Oceanside, CA 92057
Ivey Ranch-Rancho Del Oro NeighborhoodEstimated Value: $1,159,000 - $1,363,000
5
Beds
3
Baths
3,277
Sq Ft
$391/Sq Ft
Est. Value
About This Home
This home is located at 471 Lexington Cir, Oceanside, CA 92057 and is currently estimated at $1,282,544, approximately $391 per square foot. 471 Lexington Cir is a home located in San Diego County with nearby schools including Ivey Ranch Elementary School, Martin Luther King Jr. Middle School, and El Camino High School.
Ownership History
Date
Name
Owned For
Owner Type
Purchase Details
Closed on
Jan 15, 2025
Sold by
Alton Ronald and Alton Gaylene
Bought by
Alton Living Trust and Alton
Current Estimated Value
Purchase Details
Closed on
Oct 10, 2012
Sold by
Brandner Peter Irene Joslyn
Bought by
Alton Ronald and Alton Gaylene
Home Financials for this Owner
Home Financials are based on the most recent Mortgage that was taken out on this home.
Original Mortgage
$412,000
Interest Rate
3.36%
Mortgage Type
New Conventional
Purchase Details
Closed on
Apr 1, 1999
Sold by
Brandner Penny I
Bought by
Brandner Penny Irene Joslyn
Purchase Details
Closed on
Dec 8, 1998
Sold by
Lmd Ivey Ranch Llc
Bought by
Brandner Penny I
Home Financials for this Owner
Home Financials are based on the most recent Mortgage that was taken out on this home.
Original Mortgage
$273,250
Interest Rate
6.86%
Mortgage Type
Purchase Money Mortgage
Purchase Details
Closed on
Jul 31, 1998
Sold by
Brandner Wayne Edward
Bought by
Brandner Penny I
Create a Home Valuation Report for This Property
The Home Valuation Report is an in-depth analysis detailing your home's value as well as a comparison with similar homes in the area
Home Values in the Area
Average Home Value in this Area
Purchase History
| Date | Buyer | Sale Price | Title Company |
|---|---|---|---|
| Alton Living Trust | -- | None Listed On Document | |
| Alton Ronald | $515,000 | Fidelity National Title Co | |
| Brandner Penny Irene Joslyn | -- | -- | |
| Brandner Penny I | $411,500 | First American Title | |
| Brandner Penny I | -- | First American Title |
Source: Public Records
Mortgage History
| Date | Status | Borrower | Loan Amount |
|---|---|---|---|
| Previous Owner | Alton Ronald | $412,000 | |
| Previous Owner | Brandner Penny I | $273,250 |
Source: Public Records
Tax History
| Year | Tax Paid | Tax Assessment Tax Assessment Total Assessment is a certain percentage of the fair market value that is determined by local assessors to be the total taxable value of land and additions on the property. | Land | Improvement |
|---|---|---|---|---|
| 2025 | $7,003 | $634,176 | $103,072 | $531,104 |
| 2024 | $7,003 | $621,742 | $101,051 | $520,691 |
| 2023 | $6,788 | $609,552 | $99,070 | $510,482 |
| 2022 | $6,685 | $597,601 | $97,128 | $500,473 |
| 2021 | $6,711 | $585,884 | $95,224 | $490,660 |
| 2020 | $6,504 | $579,877 | $94,248 | $485,629 |
| 2019 | $6,315 | $568,507 | $92,400 | $476,107 |
| 2018 | $6,249 | $557,361 | $90,589 | $466,772 |
| 2017 | $6,134 | $546,433 | $88,813 | $457,620 |
| 2016 | $5,936 | $535,720 | $87,072 | $448,648 |
| 2015 | $5,763 | $527,674 | $85,765 | $441,909 |
| 2014 | $5,540 | $517,338 | $84,085 | $433,253 |
Source: Public Records
Map
Nearby Homes
- 741 Vista Grande Way Unit 313
- 4082 Ivey Vista Way
- 4228 Vista Panorama Way Unit 267
- 364 Vista Alegria
- 4314 Auklet Way
- 4320 Black Duck Way
- 4228 Vista Del Rio Way Unit 2
- 4402 Chickadee Way
- 4382 Dowitcher Way
- 4232 Fiesta Way Unit 3
- 101 Avenida Las Brisas
- 4440 Skimmer Way
- 4002 Craven Rd Unit 4
- 4379 Albatross Way
- 4395 Albatross Way
- 4211 Mission Ranch Way
- 4386 Albatross Way
- 1137 Avenida Sobrina
- 4310 Forest Ranch Way
- 4132 Calle Arbol
- 469 Lexington Cir
- 473 Lexington Cir
- 467 Lexington Cir
- 475 Lexington Cir
- 4283 Corte Verde
- 4285 Corte Verde
- 4279 Corte Verde
- 465 Lexington Cir
- 474 Lexington Cir
- 477 Lexington Cir
- 4277 Corte Verde
- 476 Lexington Cir
- 463 Lexington Cir
- 479 Lexington Cir
- 478 Lexington Cir
- 4273 Corte Verde
- 461 Lexington Cir
- 306 Arlington Dr
- 4274 Corte Verde
- 4278 Corte Verde
Your Personal Tour Guide
Ask me questions while you tour the home.