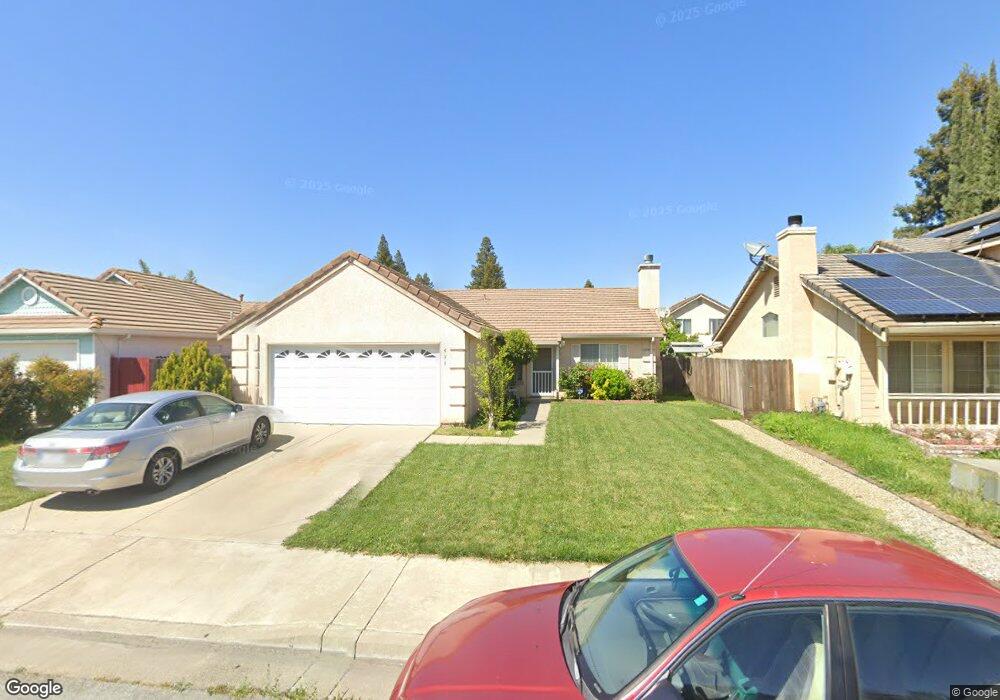
471 Rice Ct Merced, CA 95348
North Merced NeighborhoodEstimated Value: $330,000 - $417,000
4
Beds
2
Baths
1,553
Sq Ft
$245/Sq Ft
Est. Value
About This Home
This home is located at 471 Rice Ct, Merced, CA 95348 and is currently estimated at $380,822, approximately $245 per square foot. 471 Rice Ct is a home located in Merced County with nearby schools including Allan Peterson Elementary School, Herbert H. Cruickshank Middle School, and Merced High School.
Ownership History
Date
Name
Owned For
Owner Type
Purchase Details
Closed on
Nov 21, 2002
Sold by
Kong Nang Hok
Bought by
Kong Tze Fong
Current Estimated Value
Home Financials for this Owner
Home Financials are based on the most recent Mortgage that was taken out on this home.
Original Mortgage
$80,000
Interest Rate
6.12%
Mortgage Type
Purchase Money Mortgage
Create a Home Valuation Report for This Property
The Home Valuation Report is an in-depth analysis detailing your home's value as well as a comparison with similar homes in the area
Home Values in the Area
Average Home Value in this Area
Purchase History
| Date | Buyer | Sale Price | Title Company |
|---|---|---|---|
| Kong Tze Fong | -- | Transcounty Title Company |
Source: Public Records
Mortgage History
| Date | Status | Borrower | Loan Amount |
|---|---|---|---|
| Closed | Kong Tze Fong | $80,000 |
Source: Public Records
Tax History
| Year | Tax Paid | Tax Assessment Tax Assessment Total Assessment is a certain percentage of the fair market value that is determined by local assessors to be the total taxable value of land and additions on the property. | Land | Improvement |
|---|---|---|---|---|
| 2025 | $1,996 | $192,428 | $64,577 | $127,851 |
| 2024 | $1,996 | $188,656 | $63,311 | $125,345 |
| 2023 | $1,966 | $184,958 | $62,070 | $122,888 |
| 2022 | $1,936 | $181,332 | $60,853 | $120,479 |
| 2021 | $1,928 | $177,777 | $59,660 | $118,117 |
| 2020 | $1,941 | $175,955 | $59,049 | $116,906 |
| 2019 | $1,910 | $172,506 | $57,892 | $114,614 |
| 2018 | $1,743 | $169,124 | $56,757 | $112,367 |
| 2017 | $1,805 | $165,809 | $55,645 | $110,164 |
| 2016 | $1,775 | $162,558 | $54,554 | $108,004 |
| 2015 | $1,746 | $160,117 | $53,735 | $106,382 |
| 2014 | $1,707 | $156,982 | $52,683 | $104,299 |
Source: Public Records
Map
Nearby Homes
- 437 Rice Ct
- 310 Buena Vista Ct
- 3350 M St Unit 79
- 3350 M St Unit 74
- 3367 M St
- 3428 De Anza Ave
- 512 Spalding Ct
- 3362 San Jacinto Ct
- 562 Sunset Dr
- 466 Columbia Ave
- 3191 El Capitan Ave
- 3216 El Capitan Ave
- 635 Brookdale Dr
- 280 E Olive Ave
- 439 E Olive Ave
- 398 Diane Ct
- 692 Gateway Cir
- 3482 Paseo Verde Ave
- 3061 El Capitan Ave
- 3500 Paseo Verde Ave
Your Personal Tour Guide
Ask me questions while you tour the home.