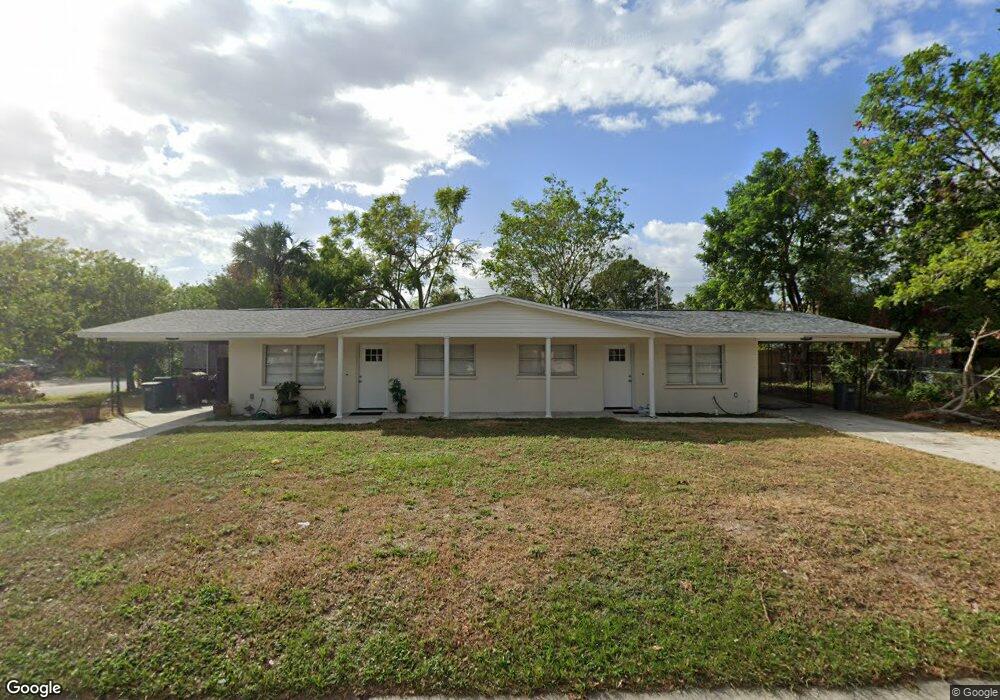
4710 18th St W Bradenton, FL 34207
South Bradenton NeighborhoodEstimated Value: $278,361 - $400,000
4
Beds
2
Baths
1,512
Sq Ft
$232/Sq Ft
Est. Value
About This Home
This home is located at 4710 18th St W, Bradenton, FL 34207 and is currently estimated at $350,840, approximately $232 per square foot. 4710 18th St W is a home located in Manatee County with nearby schools including H. S. Moody Elementary School, W. D. Sugg Middle School, and Southeast High School.
Ownership History
Date
Name
Owned For
Owner Type
Purchase Details
Closed on
Aug 10, 2022
Sold by
Riordan Rentals & Real Estate Llc
Bought by
Lionfish Investments Properties Llc
Current Estimated Value
Home Financials for this Owner
Home Financials are based on the most recent Mortgage that was taken out on this home.
Original Mortgage
$252,000
Outstanding Balance
$240,925
Interest Rate
5.51%
Mortgage Type
New Conventional
Estimated Equity
$109,915
Purchase Details
Closed on
Jan 21, 2022
Sold by
Wilkin Robert G and Wilkin Sue A
Bought by
Riordan Rentals And Real Estate Llc
Home Financials for this Owner
Home Financials are based on the most recent Mortgage that was taken out on this home.
Original Mortgage
$130,000
Interest Rate
3.11%
Mortgage Type
Balloon
Purchase Details
Closed on
Mar 7, 2008
Sold by
Stecher Steven C
Bought by
Wilkin Robert G and Wilkin Sue A
Purchase Details
Closed on
Mar 9, 2006
Sold by
Wilkin Charles J
Bought by
Wilkin Robert G
Create a Home Valuation Report for This Property
The Home Valuation Report is an in-depth analysis detailing your home's value as well as a comparison with similar homes in the area
Home Values in the Area
Average Home Value in this Area
Purchase History
| Date | Buyer | Sale Price | Title Company |
|---|---|---|---|
| Lionfish Investments Properties Llc | -- | First International Title | |
| Riordan Rentals And Real Estate Llc | $138,128 | Band Gates & Dramis Pl | |
| Wilkin Robert G | $41,700 | Attorney | |
| Wilkin Robert G | $58,400 | Attorney | |
| Wilkin Robert G | -- | Attorney | |
| Wilkin Robert G | -- | None Available |
Source: Public Records
Mortgage History
| Date | Status | Borrower | Loan Amount |
|---|---|---|---|
| Open | Lionfish Investments Properties Llc | $252,000 | |
| Previous Owner | Riordan Rentals And Real Estate Llc | $130,000 |
Source: Public Records
Tax History Compared to Growth
Tax History
| Year | Tax Paid | Tax Assessment Tax Assessment Total Assessment is a certain percentage of the fair market value that is determined by local assessors to be the total taxable value of land and additions on the property. | Land | Improvement |
|---|---|---|---|---|
| 2025 | $4,369 | $260,754 | $54,400 | $206,354 |
| 2024 | $4,369 | $260,754 | $54,400 | $206,354 |
| 2023 | $4,433 | $260,854 | $45,900 | $214,954 |
| 2022 | $3,341 | $188,689 | $45,000 | $143,689 |
| 2021 | $2,464 | $160,647 | $40,000 | $120,647 |
| 2020 | $2,424 | $154,176 | $30,000 | $124,176 |
| 2019 | $2,249 | $140,663 | $20,000 | $120,663 |
| 2018 | $1,992 | $115,007 | $15,000 | $100,007 |
| 2017 | $1,776 | $108,000 | $0 | $0 |
| 2016 | $1,683 | $100,500 | $0 | $0 |
| 2015 | $1,286 | $75,400 | $0 | $0 |
| 2014 | $1,286 | $58,730 | $0 | $0 |
| 2013 | $1,325 | $61,924 | $12,006 | $49,918 |
Source: Public Records
Map
Nearby Homes
- 4609 19th St W
- 619 49th Ave W
- 4805 22nd St W
- 4918 14th St W Unit B-2
- 4918 14th St W Unit B-7
- 4918 14th St W Unit C11
- 4918 14th St W Unit B-19
- 4918 14th St W Unit D-6
- 4700 Mineola St
- 5109 19th St W
- 5014 & 5016 22nd St W
- 4606 Mineola St
- 1117 49th Avenue Dr W
- 1117 50th Ave W
- 1109 49th Avenue Dr W
- 1110 49th Avenue Dr W
- 1112 49th Avenue Terrace W
- 4923 25th St W Unit 104
- 1106 49th Avenue Dr W
- 5110 14th St W Unit 68
- 1803 48th Ave W
- 1803 W Ave
- 4707 18th St W
- 4706 18th St W
- 4800 18th St W
- 1810 47th Avenue Dr W
- 4705 18th St W
- 1804 48th Ave W Unit A
- 1703 48th Ave W
- 4801 18th St W Unit A
- 4703 19th St W
- 1706 47th Avenue Dr W
- 1806 48th Ave W
- 1704 48th Ave W
- 4804 18th St W Unit A
- 4804 18th St W Unit A, B
- 4702 18th St W
- 1803 47th Avenue Dr W
- 4803 18th St W Unit A
- 1805 47th Avenue Dr W