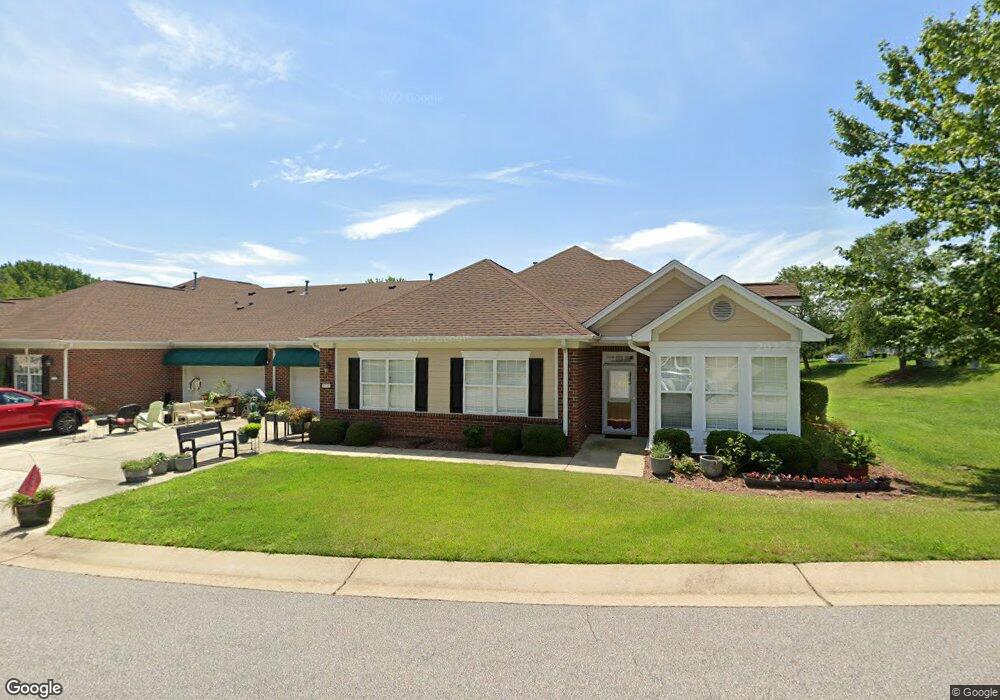
4710 Ivy Crest Ct Raleigh, NC 27604
Northeast Raleigh NeighborhoodEstimated Value: $357,000 - $387,000
3
Beds
2
Baths
1,716
Sq Ft
$215/Sq Ft
Est. Value
About This Home
This home is located at 4710 Ivy Crest Ct, Raleigh, NC 27604 and is currently estimated at $368,136, approximately $214 per square foot. 4710 Ivy Crest Ct is a home located in Wake County with nearby schools including River Bend Elementary, River Bend Middle, and Rolesville High School.
Ownership History
Date
Name
Owned For
Owner Type
Purchase Details
Closed on
Dec 22, 2015
Sold by
Newsome James W and Newsome Catherine C
Bought by
Newsome James Wyatt and James Wyatt Newsome Jr Family Trust
Current Estimated Value
Purchase Details
Closed on
Aug 7, 2015
Sold by
Newsome James W
Bought by
Newsome James W
Purchase Details
Closed on
Sep 15, 2010
Sold by
Federal Home Loan Mortgage Corporation
Bought by
Newsome James W and James Wyatt Newsome & Gertrude P Newsome
Purchase Details
Closed on
May 11, 2010
Sold by
Williams Max and Slavin Stephanie
Bought by
Federal Home Loan Mortgage Corporation
Purchase Details
Closed on
May 31, 2007
Sold by
Wkb Ivy Hall Llc
Bought by
Williams Max and Slavin Stephanie
Home Financials for this Owner
Home Financials are based on the most recent Mortgage that was taken out on this home.
Original Mortgage
$216,950
Interest Rate
7.62%
Mortgage Type
Unknown
Create a Home Valuation Report for This Property
The Home Valuation Report is an in-depth analysis detailing your home's value as well as a comparison with similar homes in the area
Home Values in the Area
Average Home Value in this Area
Purchase History
| Date | Buyer | Sale Price | Title Company |
|---|---|---|---|
| Newsome James Wyatt | -- | None Available | |
| Newsome James W | -- | Attorney | |
| Newsome James W | -- | Chicago Title Insurance Co | |
| Federal Home Loan Mortgage Corporation | $221,310 | None Available | |
| Williams Max | $255,500 | None Available |
Source: Public Records
Mortgage History
| Date | Status | Borrower | Loan Amount |
|---|---|---|---|
| Previous Owner | Williams Max | $216,950 |
Source: Public Records
Tax History Compared to Growth
Tax History
| Year | Tax Paid | Tax Assessment Tax Assessment Total Assessment is a certain percentage of the fair market value that is determined by local assessors to be the total taxable value of land and additions on the property. | Land | Improvement |
|---|---|---|---|---|
| 2025 | $3,147 | $358,581 | $60,000 | $298,581 |
| 2024 | $3,134 | $358,581 | $60,000 | $298,581 |
| 2023 | $2,913 | $265,427 | $50,000 | $215,427 |
| 2022 | $2,707 | $265,427 | $50,000 | $215,427 |
| 2021 | $2,603 | $265,427 | $50,000 | $215,427 |
| 2020 | $2,555 | $265,427 | $50,000 | $215,427 |
| 2019 | $2,637 | $225,815 | $46,000 | $179,815 |
| 2018 | $2,487 | $225,815 | $46,000 | $179,815 |
| 2017 | $2,369 | $225,815 | $46,000 | $179,815 |
| 2016 | $2,321 | $225,815 | $46,000 | $179,815 |
| 2015 | $2,587 | $247,901 | $54,000 | $193,901 |
| 2014 | $2,454 | $247,901 | $54,000 | $193,901 |
Source: Public Records
Map
Nearby Homes
- 4712 Fox Fern Ln
- 4612 Thorn Leaf Ct
- 4612 Hanging Fern Ln
- 4809 Arbor Chase Dr
- 4500 Rivershyre Way
- 4443 Antique Ln Unit D1
- 4416 Major Loring Way
- 3622 Top of the Pines Ct
- 3825 Old Coach Rd
- 3614 Top of the Pines Ct
- 3909 Iron Horse Rd
- 4139 Davis Meadow St
- 4109 Stonewall Dr
- 3936 Iron Horse Rd
- 4416 Brintons Cottage St
- 4509 Cobble Creek Ln
- 4809 Kaycee Ct
- 4508 Brintons Cottage St
- 4252 Rockdell Hall St
- 5208 Windmere Chase Dr
- 4712 Ivy Crest Ct
- 4711 Fox Fern Ln
- 4713 Fox Fern Ln
- 4622 Fox Fern Ln
- 4710 Fox Fern Ln
- 4715 Ivy Crest Ct
- 4711 Silver Quill Ct
- 4718 Ivy Crest Ct
- 4721 Fox Fern Ln
- 4713 Silver Quill Ct
- 4717 Ivy Crest Ct
- 4723 Fox Fern Ln
- 4720 Fox Fern Ln
- 4721 Silver Quill Ct
- 4719 Ivy Crest Ct
- 4621 Ivy Blossom Ln
- 4710 Silver Quill Ct
- 4623 Thorn Leaf Ct
- 4722 Fox Fern Ln
- 4712 Silver Quill Ct