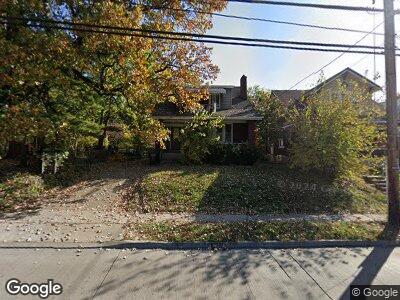
4710 Winton Rd Cincinnati, OH 45232
Spring Grove Village NeighborhoodEstimated Value: $115,000 - $177,000
3
Beds
1
Bath
1,504
Sq Ft
$103/Sq Ft
Est. Value
About This Home
This home is located at 4710 Winton Rd, Cincinnati, OH 45232 and is currently estimated at $154,429, approximately $102 per square foot. 4710 Winton Rd is a home located in Hamilton County with nearby schools including Clifton Area Neighborhood School, Robert A. Taft Information Technology High School, and Shroder High School.
Ownership History
Date
Name
Owned For
Owner Type
Purchase Details
Closed on
Sep 30, 2020
Sold by
Oli Joint Ventures Llc
Bought by
Oli Delaware Llc
Current Estimated Value
Purchase Details
Closed on
Mar 28, 2018
Sold by
Penklor Properties Llc
Bought by
Oli Joint Ventures Llc
Home Financials for this Owner
Home Financials are based on the most recent Mortgage that was taken out on this home.
Original Mortgage
$3,000,000
Interest Rate
4.38%
Mortgage Type
Commercial
Purchase Details
Closed on
Dec 17, 2009
Sold by
Rock Kenneth J
Bought by
Penklor Properties Llc
Purchase Details
Closed on
May 29, 2008
Sold by
Estate Of Margaret A Rook
Bought by
Rook Kenneth J
Create a Home Valuation Report for This Property
The Home Valuation Report is an in-depth analysis detailing your home's value as well as a comparison with similar homes in the area
Home Values in the Area
Average Home Value in this Area
Purchase History
| Date | Buyer | Sale Price | Title Company |
|---|---|---|---|
| Oli Delaware Llc | $39,000 | None Available | |
| Oli Joint Ventures Llc | $1,811,438 | None Available | |
| Penklor Properties Llc | $30,000 | Attorney | |
| Rook Kenneth J | -- | None Available |
Source: Public Records
Mortgage History
| Date | Status | Borrower | Loan Amount |
|---|---|---|---|
| Previous Owner | Oli Joint Ventures Llc | $3,000,000 | |
| Previous Owner | Penklor Properties Llc | $384,290 | |
| Previous Owner | Penklor Properties Llc | $4,225,000 | |
| Previous Owner | Penklor Properies Llc | $372,450 |
Source: Public Records
Tax History Compared to Growth
Tax History
| Year | Tax Paid | Tax Assessment Tax Assessment Total Assessment is a certain percentage of the fair market value that is determined by local assessors to be the total taxable value of land and additions on the property. | Land | Improvement |
|---|---|---|---|---|
| 2024 | $2,330 | $36,628 | $6,356 | $30,272 |
| 2023 | $2,334 | $36,628 | $6,356 | $30,272 |
| 2022 | $923 | $12,894 | $5,908 | $6,986 |
| 2021 | $903 | $12,894 | $5,908 | $6,986 |
| 2020 | $906 | $12,894 | $5,908 | $6,986 |
| 2019 | $896 | $11,617 | $5,324 | $6,293 |
| 2018 | $1,051 | $11,617 | $5,324 | $6,293 |
| 2017 | $1,142 | $11,617 | $5,324 | $6,293 |
| 2016 | $1,034 | $9,870 | $5,005 | $4,865 |
| 2015 | $954 | $9,870 | $5,005 | $4,865 |
| 2014 | $678 | $9,870 | $5,005 | $4,865 |
| 2013 | $732 | $10,501 | $5,324 | $5,177 |
Source: Public Records
Map
Nearby Homes
- 720 Froome Ave
- 732 E Epworth Ave
- 720 E Epworth Ave
- 757 Mcmakin Ave
- 4549 W Mitchell Ave
- 749 Circle Ave
- 1423 Weigold Ave
- 318 Bank Ave
- 4231 Dane Ave
- 198 W Ross Ave
- 1536 Donaldson Place
- 29 Baker Ave
- 4214 Fergus St
- 4627 Vine St
- 1535 Pullan Ave
- 1318 Knowlton St
- 4241 Vine St
- 4237 Vine St
- 4179 Mad Anthony St
- 4208 Williamson Place
- 4710 Winton Rd
- 4708 Winton Rd
- 768 Beechwood Ave
- 4706 Winton Rd
- 4718 Winton Rd
- 766 Beechwood Ave
- 764 Beechwood Ave
- 763 Froome Ave
- 4700 Winton Rd
- 762 Beechwood Ave
- 759 Froome Ave
- 4698 Winton Rd
- 754 Beechwood Ave
- 4726 Winton Rd
- 766 Froome Ave
- 4696 Winton Rd
- 761 Beechwood Ave
- 759 Beechwood Ave
- 4730 Winton Rd
- 750 Beechwood Ave