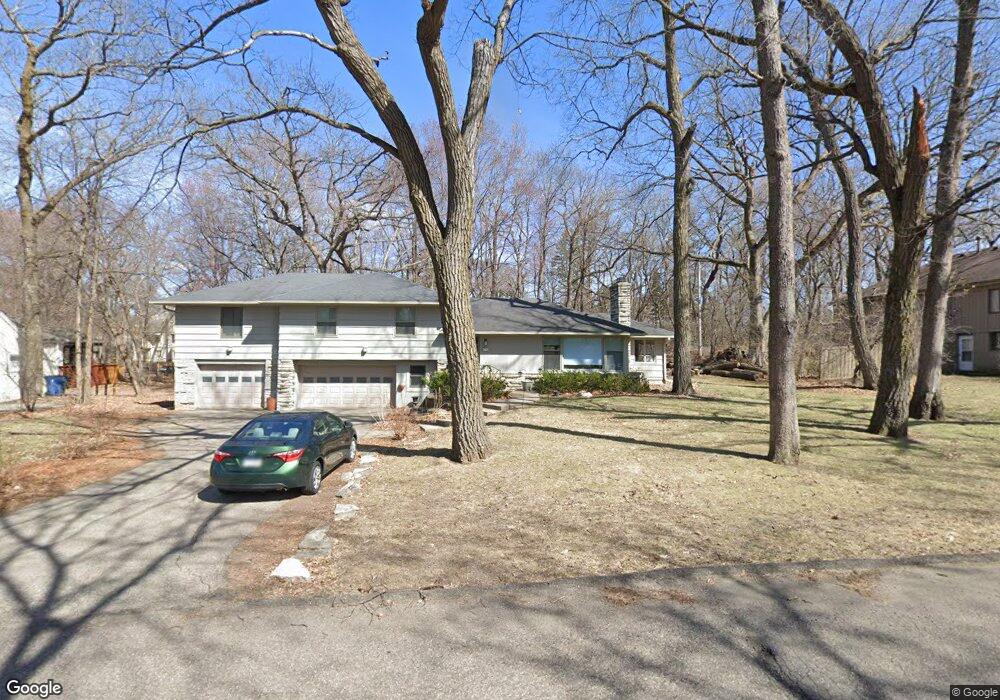
4711 Fairhills Rd E Minnetonka, MN 55345
Estimated Value: $694,257 - $817,000
4
Beds
3
Baths
3,004
Sq Ft
$249/Sq Ft
Est. Value
About This Home
This home is located at 4711 Fairhills Rd E, Minnetonka, MN 55345 and is currently estimated at $749,064, approximately $249 per square foot. 4711 Fairhills Rd E is a home located in Hennepin County with nearby schools including Scenic Heights Elementary School, Minnetonka East Middle School, and Minnetonka Senior High School.
Ownership History
Date
Name
Owned For
Owner Type
Purchase Details
Closed on
Aug 27, 2021
Sold by
Schomburg Justin Thomas
Bought by
Cleven Mulcahy Nicole Erin and Cleven Mulcahy Scott
Current Estimated Value
Home Financials for this Owner
Home Financials are based on the most recent Mortgage that was taken out on this home.
Original Mortgage
$480,000
Outstanding Balance
$436,112
Interest Rate
2.7%
Mortgage Type
New Conventional
Estimated Equity
$312,952
Purchase Details
Closed on
Jul 30, 2015
Sold by
Baier Jennifer L Dille and Baier Dan E
Bought by
Schomburg Justin Thomas
Home Financials for this Owner
Home Financials are based on the most recent Mortgage that was taken out on this home.
Original Mortgage
$308,000
Interest Rate
4.08%
Mortgage Type
New Conventional
Create a Home Valuation Report for This Property
The Home Valuation Report is an in-depth analysis detailing your home's value as well as a comparison with similar homes in the area
Purchase History
| Date | Buyer | Sale Price | Title Company |
|---|---|---|---|
| Cleven Mulcahy Nicole Erin | $600,000 | Edina Realty Title Inc | |
| Schomburg Justin Thomas | $418,000 | Edina Realty Title Inc | |
| Cleven-Mulcahy Nicole Nicole | $600,000 | -- |
Source: Public Records
Mortgage History
| Date | Status | Borrower | Loan Amount |
|---|---|---|---|
| Open | Cleven Mulcahy Nicole Erin | $480,000 | |
| Previous Owner | Schomburg Justin Thomas | $308,000 | |
| Closed | Cleven-Mulcahy Nicole Nicole | $480,000 |
Source: Public Records
Tax History
| Year | Tax Paid | Tax Assessment Tax Assessment Total Assessment is a certain percentage of the fair market value that is determined by local assessors to be the total taxable value of land and additions on the property. | Land | Improvement |
|---|---|---|---|---|
| 2024 | $8,848 | $642,600 | $213,400 | $429,200 |
| 2023 | $8,154 | $627,400 | $213,400 | $414,000 |
| 2022 | $6,511 | $607,000 | $213,400 | $393,600 |
| 2021 | $6,405 | $472,300 | $194,000 | $278,300 |
| 2020 | $6,500 | $465,800 | $194,000 | $271,800 |
| 2019 | $6,286 | $452,700 | $194,000 | $258,700 |
| 2018 | $6,062 | $435,800 | $194,000 | $241,800 |
| 2017 | $6,110 | $422,400 | $180,200 | $242,200 |
| 2016 | $5,771 | $403,700 | $165,000 | $238,700 |
| 2015 | $5,246 | $372,600 | $150,000 | $222,600 |
| 2014 | -- | $344,200 | $150,000 | $194,200 |
Source: Public Records
Map
Nearby Homes
- 15395 Highland Bluff
- 4902 Woodhurst Ln
- 4811 Highland Rd
- 15710 Highwood Dr
- 4414 Juleena Place
- 4757 Spring Cir
- 14901 Highway 7
- 4801 Spring Cir
- 4820 Williston Rd
- 4508 Williston Rd
- 4512 Williston Rd
- 4902 Beacon Hill Rd
- 16633 Temple Dr N
- 15904 Dawn Dr
- 14921 Belvoir Dr
- 5108 Beacon Hill Rd
- 5338 Highland Rd
- 14812 Belvoir Dr
- 5107 Woodhill Rd
- 14819 Cherry Ln
- 4717 Fairhills Rd E
- 4703 4703 Fairhills-Road-e
- 4710 Chantrey Place
- 4714 Fairhills Rd E
- 4725 Fairhills Rd E
- 4716 Chantrey Place
- 4633 Fairhills Rd E
- 4704 Chantrey Place
- 4706 Fairhills Rd E
- 4730 Fairhills Rd E
- 4719 Fairhills Rd W
- 4724 Chantrey Place
- 4625 Fairhills Rd E
- 4801 Fairhills Rd W
- 4630 Fairhills Rd E
- 4713 Fairhills Rd W
- 4698 Chantrey Place
- 4699 Chantrey Place
- 4705 Fairhills Rd W
- 4705 Chantrey Place
Your Personal Tour Guide
Ask me questions while you tour the home.