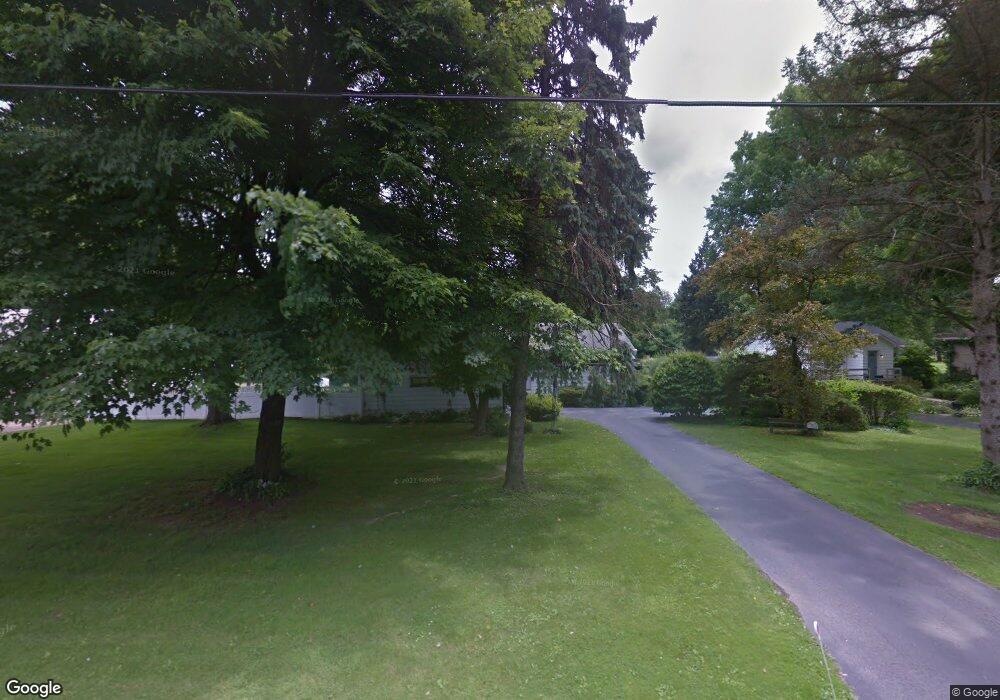
4711 Simon Rd Youngstown, OH 44512
Estimated Value: $126,000 - $155,395
2
Beds
2
Baths
1,232
Sq Ft
$118/Sq Ft
Est. Value
About This Home
This home is located at 4711 Simon Rd, Youngstown, OH 44512 and is currently estimated at $145,849, approximately $118 per square foot. 4711 Simon Rd is a home located in Mahoning County with nearby schools including Robinwood Lane Elementary School, Boardman Glenwood Junior High School, and Boardman High School.
Ownership History
Date
Name
Owned For
Owner Type
Purchase Details
Closed on
Jul 22, 2024
Sold by
Taylor Marcia K and Taylor Andrew
Bought by
Taylor Marcia K and Taylor Andrew
Current Estimated Value
Purchase Details
Closed on
Mar 6, 1995
Sold by
Klenotic Elaine
Bought by
Taylor Andrew J and Taylor Marcia K
Home Financials for this Owner
Home Financials are based on the most recent Mortgage that was taken out on this home.
Original Mortgage
$46,000
Interest Rate
8.82%
Mortgage Type
New Conventional
Purchase Details
Closed on
Feb 20, 1973
Bought by
Horvatt Joseph
Create a Home Valuation Report for This Property
The Home Valuation Report is an in-depth analysis detailing your home's value as well as a comparison with similar homes in the area
Home Values in the Area
Average Home Value in this Area
Purchase History
| Date | Buyer | Sale Price | Title Company |
|---|---|---|---|
| Taylor Marcia K | -- | None Listed On Document | |
| Taylor Andrew J | $64,000 | -- | |
| Horvatt Joseph | -- | -- |
Source: Public Records
Mortgage History
| Date | Status | Borrower | Loan Amount |
|---|---|---|---|
| Previous Owner | Taylor Andrew J | $46,000 |
Source: Public Records
Tax History Compared to Growth
Tax History
| Year | Tax Paid | Tax Assessment Tax Assessment Total Assessment is a certain percentage of the fair market value that is determined by local assessors to be the total taxable value of land and additions on the property. | Land | Improvement |
|---|---|---|---|---|
| 2024 | $1,559 | $39,800 | $8,190 | $31,610 |
| 2023 | $1,569 | $39,800 | $8,190 | $31,610 |
| 2022 | $1,222 | $26,810 | $8,010 | $18,800 |
| 2021 | $1,223 | $26,810 | $8,010 | $18,800 |
| 2020 | $1,229 | $26,810 | $8,010 | $18,800 |
| 2019 | $1,051 | $21,790 | $6,510 | $15,280 |
| 2018 | $869 | $21,790 | $6,510 | $15,280 |
| 2017 | $847 | $21,790 | $6,510 | $15,280 |
| 2016 | $1,038 | $24,660 | $7,280 | $17,380 |
| 2015 | $1,018 | $24,660 | $7,280 | $17,380 |
| 2014 | $1,021 | $24,660 | $7,280 | $17,380 |
| 2013 | $1,008 | $24,660 | $7,280 | $17,380 |
Source: Public Records
Map
Nearby Homes
- 4622 Simon Rd
- 4534 South Ave
- 744 Nellbert Ln
- 429 Tudor Ln
- 4212 South Ave
- 4197 South Ave
- 0 Cranberry Ln Unit 5119702
- 4552 New England Blvd
- 0 Mulberry Ln Unit 5119623
- 0 Indianola Rd
- 885 Afton Ave
- 1513 Wakefield Ave
- 323 Melrose Ave
- 3930 Sunset Dr
- 0 Moyer Ave
- 0 Lemoyne Ave
- 1720 Sequoya Dr
- 268 Erskine Ave
- 1560 Wakefield Ave
- 186 Maple Dr