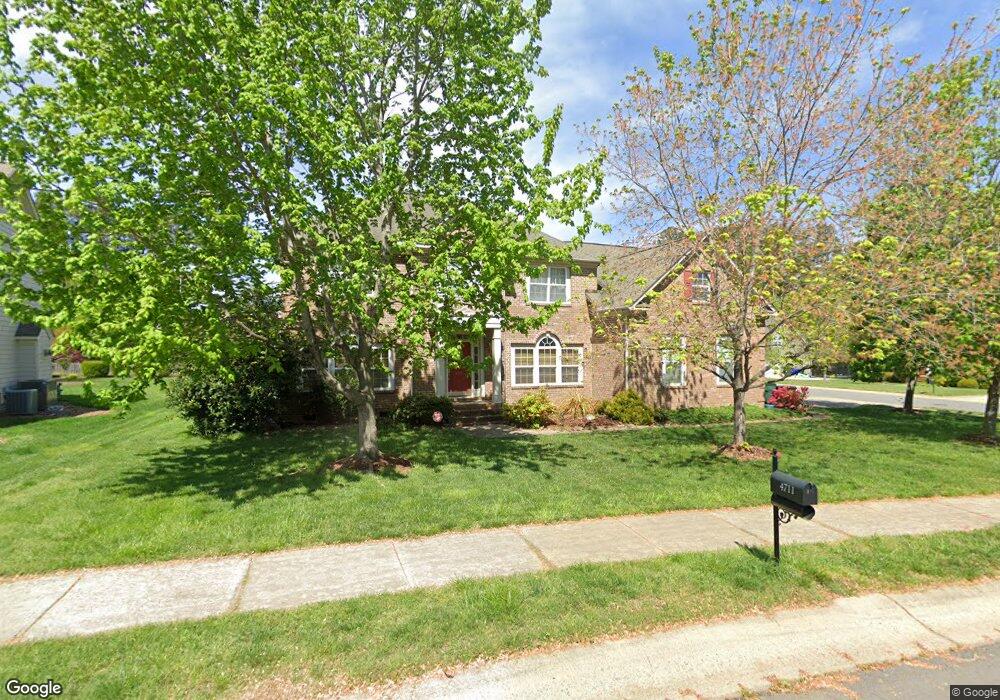
4711 Sycamore Shoals Rd Durham, NC 27705
West Durham NeighborhoodEstimated Value: $865,319 - $903,000
4
Beds
4
Baths
3,696
Sq Ft
$241/Sq Ft
Est. Value
About This Home
This home is located at 4711 Sycamore Shoals Rd, Durham, NC 27705 and is currently estimated at $890,830, approximately $241 per square foot. 4711 Sycamore Shoals Rd is a home located in Durham County with nearby schools including Morehead Montessori, Brogden Middle, and Riverside High School.
Ownership History
Date
Name
Owned For
Owner Type
Purchase Details
Closed on
Sep 15, 2020
Sold by
Murphy James H and Murphy Beverly
Bought by
Murphy Beverly
Current Estimated Value
Home Financials for this Owner
Home Financials are based on the most recent Mortgage that was taken out on this home.
Original Mortgage
$341,700
Outstanding Balance
$273,278
Interest Rate
2.8%
Mortgage Type
New Conventional
Estimated Equity
$617,552
Purchase Details
Closed on
Mar 15, 2010
Sold by
Murphy James
Bought by
Murphy Beverly
Purchase Details
Closed on
Aug 30, 2006
Sold by
The Drees Co
Bought by
Murphy James H and Murphy Beverly
Home Financials for this Owner
Home Financials are based on the most recent Mortgage that was taken out on this home.
Original Mortgage
$358,800
Interest Rate
6.73%
Mortgage Type
Purchase Money Mortgage
Purchase Details
Closed on
Mar 6, 2006
Sold by
Rhein Interests Of Raleigh Llc
Bought by
The Drees Co and The Drees Homes Co
Create a Home Valuation Report for This Property
The Home Valuation Report is an in-depth analysis detailing your home's value as well as a comparison with similar homes in the area
Home Values in the Area
Average Home Value in this Area
Purchase History
| Date | Buyer | Sale Price | Title Company |
|---|---|---|---|
| Murphy Beverly | -- | Accommodation | |
| Murphy Beverly | -- | None Available | |
| Murphy James H | $449,000 | None Available | |
| The Drees Co | $255,000 | None Available |
Source: Public Records
Mortgage History
| Date | Status | Borrower | Loan Amount |
|---|---|---|---|
| Open | Murphy Beverly | $341,700 | |
| Closed | Murphy James H | $358,800 | |
| Closed | Murphy James H | $40,000 |
Source: Public Records
Tax History Compared to Growth
Tax History
| Year | Tax Paid | Tax Assessment Tax Assessment Total Assessment is a certain percentage of the fair market value that is determined by local assessors to be the total taxable value of land and additions on the property. | Land | Improvement |
|---|---|---|---|---|
| 2025 | $7,837 | $790,566 | $144,840 | $645,726 |
| 2024 | $6,627 | $475,091 | $88,437 | $386,654 |
| 2023 | $6,223 | $475,091 | $88,437 | $386,654 |
| 2022 | $6,081 | $475,091 | $88,437 | $386,654 |
| 2021 | $6,052 | $475,091 | $88,437 | $386,654 |
| 2020 | $5,910 | $475,091 | $88,437 | $386,654 |
| 2019 | $5,910 | $475,091 | $88,437 | $386,654 |
| 2018 | $6,168 | $454,708 | $77,825 | $376,883 |
| 2017 | $6,123 | $454,708 | $77,825 | $376,883 |
| 2016 | $5,916 | $487,481 | $77,825 | $409,656 |
| 2015 | $6,672 | $481,983 | $90,012 | $391,971 |
| 2014 | $6,672 | $481,983 | $90,012 | $391,971 |
Source: Public Records
Map
Nearby Homes
- 4704 Cumberland Dr
- 108 Panamint Dr
- 112 Salmon River Dr
- 4709 Stafford Dr
- 1013 Coldspring Cir
- Townhome B Exterior Plan at Croasdaile Farm - Bronze Leaf Townhomes
- Custom Plan at Croasdaile Farm - Bronze Leaf Townhomes
- Townhome B Interior Plan at Croasdaile Farm - Bronze Leaf Townhomes
- Townhome A Exterior Plan at Croasdaile Farm - Bronze Leaf Townhomes
- Townhome A Interior Plan at Croasdaile Farm - Bronze Leaf Townhomes
- 1031 Coldspring Cir
- 4316 American Dr
- 28 Prestwick Place
- 4825 Stafford Dr
- 37 Georgetown Ct
- 210 Silas St
- 123 Forest Oaks Dr
- 74 Forest Oaks Dr
- 13 Providence Ct
- 82 Forest Oaks Dr
- 4709 Sycamore Shoals Rd
- 4607 Cumberland Dr
- 4604 Cumberland Dr
- 4505 Cumberland Dr
- 4707 Sycamore Shoals Rd
- 4606 Cumberland Dr
- 4602 Cumberland Dr
- 4609 Cumberland Dr
- 4608 Cumberland Dr
- 4504 Cumberland Dr
- 102 Musket Ln
- 4503 Cumberland Dr
- 4610 Cumberland Dr
- 4705 Sycamore Shoals Rd
- 4706 Sycamore Shoals Rd
- 101 Tannenbaum St
- 4612 Cumberland Dr
- 103 Musket Ln
- 103 Musket Ln Unit 83
- 201 Regiment Way