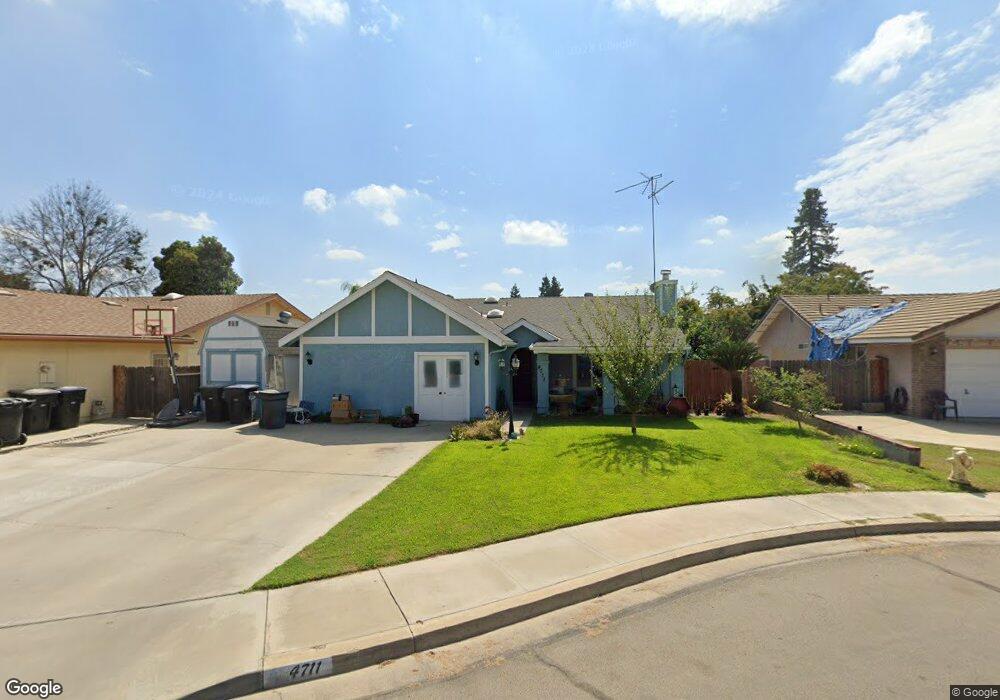
4711 W Iris Ct Visalia, CA 93277
Estimated Value: $330,044 - $426,000
3
Beds
3
Baths
1,470
Sq Ft
$252/Sq Ft
Est. Value
About This Home
This home is located at 4711 W Iris Ct, Visalia, CA 93277 and is currently estimated at $370,011, approximately $251 per square foot. 4711 W Iris Ct is a home located in Tulare County with nearby schools including Veva Blunt Elementary School, La Joya Middle School, and El Diamante High School.
Ownership History
Date
Name
Owned For
Owner Type
Purchase Details
Closed on
Mar 3, 2014
Sold by
Thomas Timothy
Bought by
Thomas Darlene M
Current Estimated Value
Home Financials for this Owner
Home Financials are based on the most recent Mortgage that was taken out on this home.
Original Mortgage
$113,960
Outstanding Balance
$85,650
Interest Rate
4.12%
Mortgage Type
FHA
Estimated Equity
$284,361
Purchase Details
Closed on
May 17, 2011
Sold by
Jones Steve
Bought by
Jones Darlene
Purchase Details
Closed on
Nov 30, 1998
Sold by
Jones Steve
Bought by
Jones Steve and Jones Darlene
Purchase Details
Closed on
Oct 30, 1997
Sold by
Johnson Edna J
Bought by
Johnson Edna J
Purchase Details
Closed on
Feb 10, 1996
Sold by
Johnson Edna J
Bought by
Jones Steve and Jones Darlene
Create a Home Valuation Report for This Property
The Home Valuation Report is an in-depth analysis detailing your home's value as well as a comparison with similar homes in the area
Home Values in the Area
Average Home Value in this Area
Purchase History
| Date | Buyer | Sale Price | Title Company |
|---|---|---|---|
| Thomas Darlene M | -- | First American Title Company | |
| Thomas Darlene M | -- | First American Title Company | |
| Jones Darlene | -- | None Available | |
| Jones Steve | -- | -- | |
| Johnson Edna J | -- | -- | |
| Jones Steve | -- | -- |
Source: Public Records
Mortgage History
| Date | Status | Borrower | Loan Amount |
|---|---|---|---|
| Open | Thomas Darlene M | $113,960 |
Source: Public Records
Tax History Compared to Growth
Tax History
| Year | Tax Paid | Tax Assessment Tax Assessment Total Assessment is a certain percentage of the fair market value that is determined by local assessors to be the total taxable value of land and additions on the property. | Land | Improvement |
|---|---|---|---|---|
| 2025 | $1,664 | $164,467 | $47,902 | $116,565 |
| 2024 | $1,664 | $161,243 | $46,963 | $114,280 |
| 2023 | $1,617 | $158,083 | $46,043 | $112,040 |
| 2022 | $1,543 | $154,985 | $45,141 | $109,844 |
| 2021 | $1,544 | $151,946 | $44,256 | $107,690 |
| 2020 | $1,527 | $150,388 | $43,802 | $106,586 |
| 2019 | $1,485 | $147,439 | $42,943 | $104,496 |
| 2018 | $1,443 | $144,548 | $42,101 | $102,447 |
| 2017 | $1,430 | $141,713 | $41,275 | $100,438 |
| 2016 | $1,398 | $138,935 | $40,466 | $98,469 |
| 2015 | $1,356 | $136,848 | $39,858 | $96,990 |
| 2014 | $1,356 | $134,167 | $39,077 | $95,090 |
Source: Public Records
Map
Nearby Homes
- 4614 W Howard Ave
- 4737 W Iris Ave
- 4747 W Iris Ave
- 1233 S Kent St
- 4615 W Feemster Ave
- 4438 W Feemster Ave
- 924 S Jennie St
- 849 S Cindy St
- 4024 W Howard Ave
- 5505 W Tulare Ave Unit 15
- 5505 W Tulare Ave Unit 24
- 5505 W Tulare Ave Unit 246
- 5505 W Tulare Ave Unit 379
- 5505 W Tulare Ave Unit 64
- 5505 W Tulare Ave Unit 113
- 5505 W Tulare Ave Unit 406
- 5505 W Tulare Ave Unit 378
- 820 S Chinowth St Unit 93
- 820 S Chinowth St Unit 102
- 820 S Chinowth St
- 4703 W Iris Ct
- 4717 W Iris Ct
- 4641 W Iris Ave
- 4700 W Howard Ave
- 4641 W Iris Ave
- 4722 W Howard Ave
- 4642 W Howard Ave
- 4736 W Howard Ave
- 4721 W Iris Ct
- 4634 W Howard Ave
- 4635 W Iris Ave
- 4635 W Iris Ave
- 4710 W Iris Ct
- 4704 W Iris Ct
- 4750 W Howard Ave
- 4630 W Howard Ave
- 4720 W Iris Ct
- 4642 W Iris Ave
- 4830 W Howard Ave
- 4636 W Iris Ave