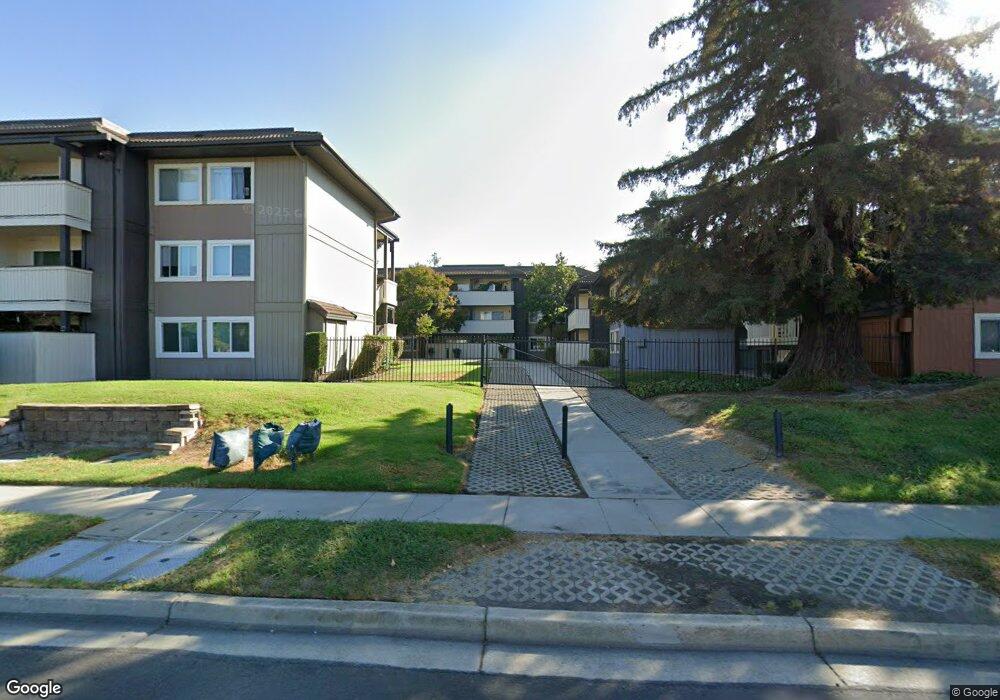
47112 Warm Spgs Blvd Unit 109 Fremont, CA 94539
Warm Springs NeighborhoodEstimated Value: $615,520 - $644,000
2
Beds
1
Bath
900
Sq Ft
$702/Sq Ft
Est. Value
About This Home
This home is located at 47112 Warm Spgs Blvd Unit 109, Fremont, CA 94539 and is currently estimated at $631,880, approximately $702 per square foot. 47112 Warm Spgs Blvd Unit 109 is a home located in Alameda County with nearby schools including Warm Springs Elementary School, James Leitch Elementary School, and John M. Horner Junior High School.
Ownership History
Date
Name
Owned For
Owner Type
Purchase Details
Closed on
Nov 18, 2020
Sold by
Lao Joanne C and Jamoles John F
Bought by
Nguyen Aj Trung
Current Estimated Value
Home Financials for this Owner
Home Financials are based on the most recent Mortgage that was taken out on this home.
Original Mortgage
$449,600
Outstanding Balance
$400,080
Interest Rate
2.8%
Mortgage Type
New Conventional
Estimated Equity
$231,800
Purchase Details
Closed on
Mar 19, 2013
Sold by
Yang Xinli J
Bought by
Lao Joanne C and Jamoles John F
Home Financials for this Owner
Home Financials are based on the most recent Mortgage that was taken out on this home.
Original Mortgage
$232,500
Interest Rate
3.49%
Mortgage Type
New Conventional
Purchase Details
Closed on
Aug 20, 2010
Sold by
Zhou Todd Tao
Bought by
Yang Xinli J
Purchase Details
Closed on
May 27, 2009
Sold by
Rachele Cesar Bruce and Rachele Cesar
Bought by
Yang Xinli J
Create a Home Valuation Report for This Property
The Home Valuation Report is an in-depth analysis detailing your home's value as well as a comparison with similar homes in the area
Home Values in the Area
Average Home Value in this Area
Purchase History
| Date | Buyer | Sale Price | Title Company |
|---|---|---|---|
| Nguyen Aj Trung | $562,000 | First American Title Company | |
| Lao Joanne C | $310,000 | First American Title Company | |
| Yang Xinli J | -- | First American Title Company | |
| Yang Xinli J | $240,000 | First American Title Company |
Source: Public Records
Mortgage History
| Date | Status | Borrower | Loan Amount |
|---|---|---|---|
| Open | Nguyen Aj Trung | $449,600 | |
| Previous Owner | Lao Joanne C | $232,500 |
Source: Public Records
Tax History Compared to Growth
Tax History
| Year | Tax Paid | Tax Assessment Tax Assessment Total Assessment is a certain percentage of the fair market value that is determined by local assessors to be the total taxable value of land and additions on the property. | Land | Improvement |
|---|---|---|---|---|
| 2025 | $7,473 | $608,320 | $182,496 | $425,824 |
| 2024 | $7,473 | $596,394 | $178,918 | $417,476 |
| 2023 | $7,269 | $584,704 | $175,411 | $409,293 |
| 2022 | $7,170 | $573,240 | $171,972 | $401,268 |
| 2021 | $7,002 | $562,000 | $168,600 | $393,400 |
| 2020 | $4,589 | $349,047 | $104,714 | $244,333 |
| 2019 | $4,539 | $342,205 | $102,661 | $239,544 |
| 2018 | $4,449 | $335,497 | $100,649 | $234,848 |
| 2017 | $4,339 | $328,918 | $98,675 | $230,243 |
| 2016 | $4,257 | $322,470 | $96,741 | $225,729 |
| 2015 | $4,191 | $317,628 | $95,288 | $222,340 |
| 2014 | $4,121 | $311,407 | $93,422 | $217,985 |
Source: Public Records
Map
Nearby Homes
- 136 Hackamore Ln Unit 18
- 199 E Warren Common
- 281 Hackamore Common
- 47236 Cavanaugh Common
- 524 E Warren Ave
- 46869 Fernald Common Unit 38
- 46867 Fernald Common
- 46762 Winema Common
- 46935 Aloe Ct
- 46925 Aloe Ct
- 45897 Bridgeport Place
- 48287 Sawleaf St
- 48346 Cottonwood St
- 2250 Kilowatt Way Unit 214
- 1748 Kilowatt Way Unit 301
- 296 Kansas Way
- 45258 Tom Blalock St Unit 100
- 45128 Warm Springs Blvd Unit 523
- 45128 Warm Springs Blvd Unit 323
- 3512 Vision Common Unit 511
- 47112 Warm Spgs Blvd Unit 206
- 47112 Warm Spgs Blvd Unit 106
- 47112 Warm Spgs Blvd Unit 207
- 47112 Warm Spgs Blvd Unit 107
- 47112 Warm Spgs Blvd Unit 208
- 47112 Warm Spgs Blvd Unit 108
- 47112 Warm Spgs Blvd Unit 309
- 47112 Warm Spgs Blvd Unit 209
- 47112 Warm Spgs Blvd Unit 310
- 47112 Warm Spgs Blvd Unit 210
- 47112 Warm Spgs Blvd Unit 110
- 47112 Warm Spgs Blvd Unit 312
- 47112 Warm Spgs Blvd Unit 212
- 47112 Warm Spgs Blvd Unit 112
- 47112 Warm Spgs Blvd Unit 314
- 47112 Warm Spgs Blvd Unit 129
- 47112 Warm Spgs Blvd Unit 227
- 47112 Warm Spgs Blvd Unit 127
- 47112 Warm Spgs Blvd Unit 225
- 47112 Warm Spgs Blvd Unit 125