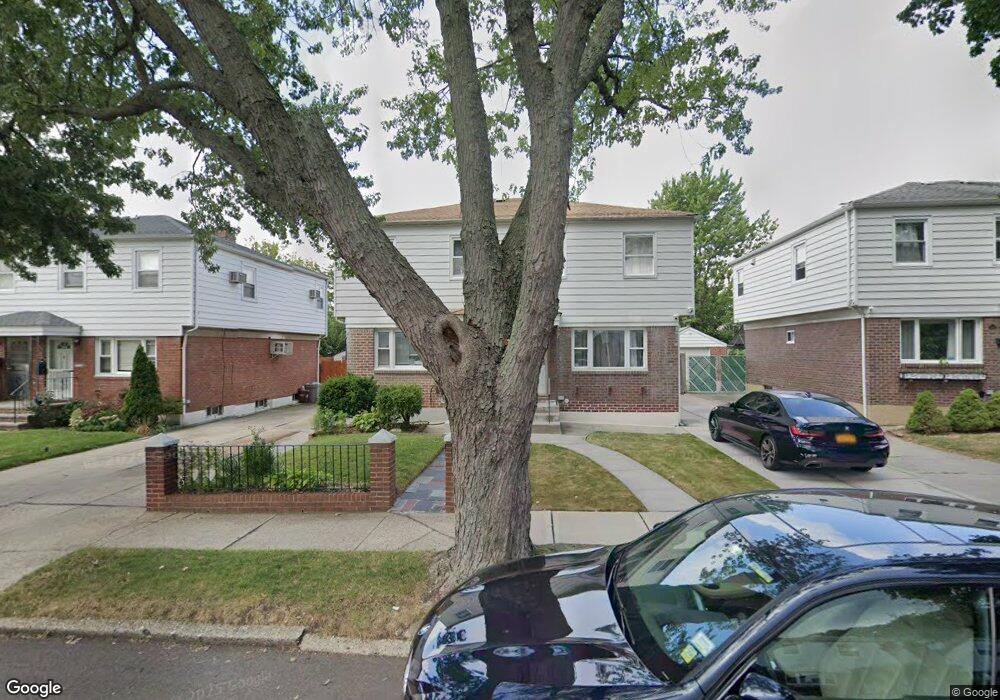
4712 169th St Flushing, NY 11358
Flushing NeighborhoodEstimated Value: $784,282 - $960,000
--
Bed
--
Bath
1,020
Sq Ft
$867/Sq Ft
Est. Value
About This Home
This home is located at 4712 169th St, Flushing, NY 11358 and is currently estimated at $884,071, approximately $866 per square foot. 4712 169th St is a home located in Queens County with nearby schools including George J. Ryan Middle School 216, Francis Lewis High School, and St Kevin School.
Ownership History
Date
Name
Owned For
Owner Type
Purchase Details
Closed on
Sep 21, 2004
Sold by
Defelippis Anthony and De Felippis Nicole
Bought by
Pizarro Josette and Sankerdial Yugisteer
Current Estimated Value
Home Financials for this Owner
Home Financials are based on the most recent Mortgage that was taken out on this home.
Original Mortgage
$364,000
Interest Rate
5.84%
Mortgage Type
Purchase Money Mortgage
Purchase Details
Closed on
Aug 21, 1998
Sold by
Cipolla Mark J and Cipolla Lourdes M
Bought by
Defelippis Anthony and Defelippis Nicole Lena
Home Financials for this Owner
Home Financials are based on the most recent Mortgage that was taken out on this home.
Original Mortgage
$187,000
Interest Rate
6.9%
Create a Home Valuation Report for This Property
The Home Valuation Report is an in-depth analysis detailing your home's value as well as a comparison with similar homes in the area
Home Values in the Area
Average Home Value in this Area
Purchase History
| Date | Buyer | Sale Price | Title Company |
|---|---|---|---|
| Pizarro Josette | $455,000 | -- | |
| Pizarro Josette | $455,000 | -- | |
| Defelippis Anthony | $212,000 | -- | |
| Defelippis Anthony | $212,000 | -- |
Source: Public Records
Mortgage History
| Date | Status | Borrower | Loan Amount |
|---|---|---|---|
| Open | Pizarro Josette | $68,250 | |
| Closed | Pizarro Josette | $68,250 | |
| Previous Owner | Pizarro Josette | $364,000 | |
| Previous Owner | Defelippis Anthony | $187,000 |
Source: Public Records
Tax History Compared to Growth
Tax History
| Year | Tax Paid | Tax Assessment Tax Assessment Total Assessment is a certain percentage of the fair market value that is determined by local assessors to be the total taxable value of land and additions on the property. | Land | Improvement |
|---|---|---|---|---|
| 2025 | $6,867 | $39,214 | $11,899 | $27,315 |
| 2024 | $6,867 | $37,069 | $11,663 | $25,406 |
| 2023 | $6,446 | $34,974 | $10,683 | $24,291 |
| 2022 | $6,379 | $45,360 | $13,800 | $31,560 |
| 2021 | $6,387 | $45,960 | $13,800 | $32,160 |
| 2020 | $6,011 | $46,500 | $13,800 | $32,700 |
| 2019 | $5,567 | $50,280 | $13,800 | $36,480 |
| 2018 | $5,644 | $29,145 | $11,362 | $17,783 |
| 2017 | $5,618 | $29,030 | $9,995 | $19,035 |
| 2016 | $5,461 | $29,030 | $9,995 | $19,035 |
| 2015 | $3,083 | $27,232 | $13,077 | $14,155 |
| 2014 | $3,083 | $25,743 | $12,697 | $13,046 |
Source: Public Records
Map
Nearby Homes
- 47-04 167th St
- 4919 169th St
- 4940 169th St
- 47-23 164th St
- 16622 Metcalf Ave
- 16475 Underhill Ave
- 164-75 Underhill Ave
- 16471 Underhill Ave
- 173-16 Fairchild Ave
- 171-06 Bagley Ave
- 162-19 Laburnum Ave
- 47-18 163rd St
- 17446 Gladwin Ave
- 175-28 Underhill Ave
- 4547 166th St
- 45-31 169th St
- 4953 Fresh Meadow Ln
- 47-09 188th St
- 4620 161st St Unit B2
- 46-12 161st St Unit 1D