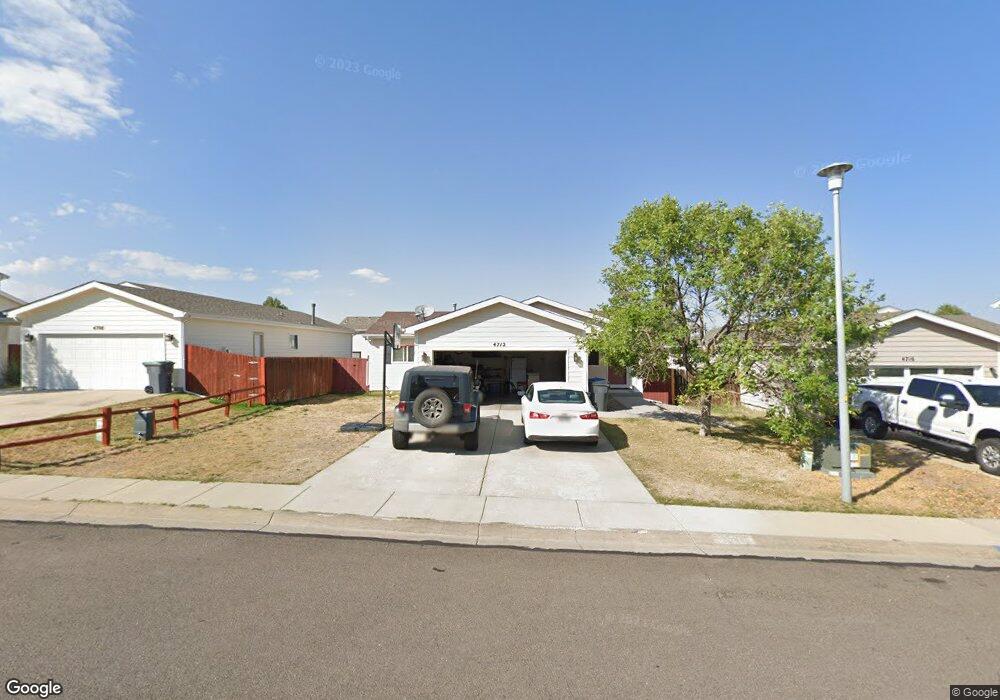
4712 Long Branch Loop Cheyenne, WY 82001
Estimated Value: $360,000 - $391,682
--
Bed
--
Bath
1,092
Sq Ft
$349/Sq Ft
Est. Value
About This Home
This home is located at 4712 Long Branch Loop, Cheyenne, WY 82001 and is currently estimated at $380,671, approximately $348 per square foot. 4712 Long Branch Loop is a home located in Laramie County with nearby schools including Bain Elementary School, Johnson Junior High School, and South High School.
Ownership History
Date
Name
Owned For
Owner Type
Purchase Details
Closed on
Jun 3, 2004
Sold by
Downey Andrew X
Bought by
Downey Ii Andrew X
Current Estimated Value
Purchase Details
Closed on
Nov 6, 2003
Sold by
Schaffer Bruce A
Bought by
Downey Andrew X
Purchase Details
Closed on
Mar 27, 2002
Sold by
Parkside Homes Llc
Bought by
Schaffer Bruce A
Home Financials for this Owner
Home Financials are based on the most recent Mortgage that was taken out on this home.
Original Mortgage
$118,410
Interest Rate
6.83%
Mortgage Type
FHA
Purchase Details
Closed on
Feb 9, 2002
Sold by
Cheyenne Ranch Llc
Bought by
Parkside Homes Llc
Home Financials for this Owner
Home Financials are based on the most recent Mortgage that was taken out on this home.
Original Mortgage
$118,410
Interest Rate
6.83%
Mortgage Type
FHA
Create a Home Valuation Report for This Property
The Home Valuation Report is an in-depth analysis detailing your home's value as well as a comparison with similar homes in the area
Home Values in the Area
Average Home Value in this Area
Purchase History
| Date | Buyer | Sale Price | Title Company |
|---|---|---|---|
| Downey Ii Andrew X | -- | -- | |
| Downey Andrew X | -- | -- | |
| Schaffer Bruce A | -- | -- | |
| Parkside Homes Llc | -- | -- |
Source: Public Records
Mortgage History
| Date | Status | Borrower | Loan Amount |
|---|---|---|---|
| Previous Owner | Schaffer Bruce A | $118,410 | |
| Previous Owner | Parkside Homes Llc | $93,036 |
Source: Public Records
Tax History Compared to Growth
Tax History
| Year | Tax Paid | Tax Assessment Tax Assessment Total Assessment is a certain percentage of the fair market value that is determined by local assessors to be the total taxable value of land and additions on the property. | Land | Improvement |
|---|---|---|---|---|
| 2025 | $2,040 | $22,253 | $4,081 | $18,172 |
| 2024 | $2,040 | $28,847 | $5,441 | $23,406 |
| 2023 | $2,042 | $28,876 | $5,441 | $23,435 |
| 2022 | $1,958 | $27,120 | $5,441 | $21,679 |
| 2021 | $1,825 | $25,231 | $5,441 | $19,790 |
| 2020 | $1,749 | $24,250 | $5,441 | $18,809 |
| 2019 | $1,603 | $22,207 | $5,441 | $16,766 |
| 2018 | $1,544 | $21,586 | $5,405 | $16,181 |
| 2017 | $1,498 | $20,753 | $4,118 | $16,635 |
| 2016 | $1,313 | $18,189 | $4,111 | $14,078 |
| 2015 | $1,239 | $17,148 | $4,111 | $13,037 |
| 2014 | $1,240 | $17,056 | $4,111 | $12,945 |
Source: Public Records
Map
Nearby Homes
- 4701 Long Branch Loop
- 1913 Prairie Dog Dr
- 1809 Copperville Rd
- 4811 E 14th St
- Tr 3 E Pershing Blvd
- TR 2 E Pershing Blvd
- 4802 E 13th St
- TBD Taft Ave
- 5502 Aurora Place
- 4904 E Pershing Blvd
- 4404 Cottage Ln
- 1720 Maroon Dr
- 1519 Adams Ave
- 1442 Monroe Ct
- 1309 Diamond Ave
- TBD Atkin St
- 5816 Parkside Dr
- 1511 Gettysburg Dr
- 1301 Diamond Ave
- Lot 1 Block 2 N College Dr
- 4716 Long Branch Loop
- 4708 Long Branch Loop
- 4720 Long Branch Loop
- 4702 Long Branch Loop
- 4713 Ranch House Way
- 4717 Ranch House Way
- 4709 Ranch House Way
- 4721 Ranch House Way
- 4703 Ranch House Way
- 4800 Long Branch Loop
- 4715 Long Branch Loop
- 4711 Long Branch Loop
- 4626 Long Branch Loop
- 4719 Long Branch Loop
- 4705 Long Branch Loop
- 4631 Ranch House Way
- 4627 Ranch House Way
- 4627 Long Branch Loop
- 4805 Long Branch Loop
- 4712 Ranch House Way