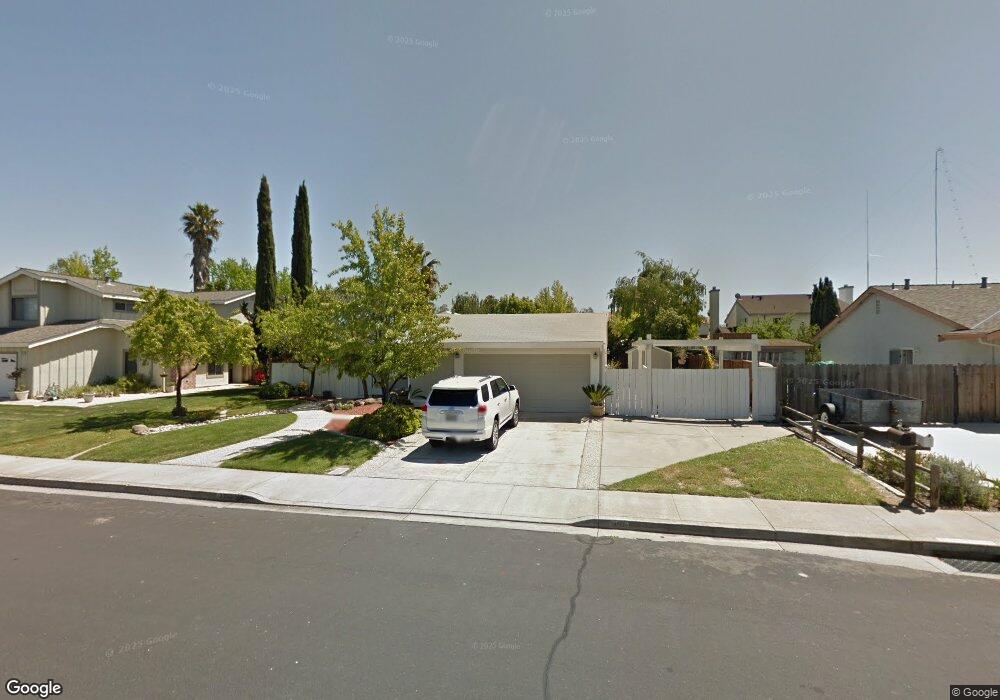
4713 Capriconus Ave Livermore, CA 94551
Springtown NeighborhoodEstimated Value: $942,000 - $1,051,000
4
Beds
2
Baths
1,409
Sq Ft
$711/Sq Ft
Est. Value
About This Home
This home is located at 4713 Capriconus Ave, Livermore, CA 94551 and is currently estimated at $1,002,345, approximately $711 per square foot. 4713 Capriconus Ave is a home located in Alameda County with nearby schools including Altamont Creek Elementary School, Andrew N. Christensen Middle School, and Livermore High School.
Ownership History
Date
Name
Owned For
Owner Type
Purchase Details
Closed on
Nov 18, 2022
Sold by
Gomes Michael A and Gomes Eva M
Bought by
Gomes Family Trust
Current Estimated Value
Purchase Details
Closed on
Jun 29, 2018
Sold by
Ridolfi Michael D and Ridolfi Erika J
Bought by
Gomes Michael A and Gomes Eva M
Purchase Details
Closed on
Jul 30, 2013
Sold by
Ridolfi Mike and Ridolfi Erika
Bought by
Ridolfi Michael D and Ridolfi Erika J
Purchase Details
Closed on
Nov 19, 2010
Sold by
Td Usa Investment Inc
Bought by
Ridolfi Mike and Ridolfi Erika
Home Financials for this Owner
Home Financials are based on the most recent Mortgage that was taken out on this home.
Original Mortgage
$286,000
Interest Rate
4.16%
Mortgage Type
New Conventional
Purchase Details
Closed on
Jun 25, 2010
Sold by
Kakkar Neelam
Bought by
Td Usa Investment Inc
Purchase Details
Closed on
Dec 29, 2003
Sold by
Batna Gurdayal and Batna Kamlesh
Bought by
Kakkar Neelam
Create a Home Valuation Report for This Property
The Home Valuation Report is an in-depth analysis detailing your home's value as well as a comparison with similar homes in the area
Home Values in the Area
Average Home Value in this Area
Purchase History
| Date | Buyer | Sale Price | Title Company |
|---|---|---|---|
| Gomes Family Trust | -- | -- | |
| Gomes Michael A | $775,000 | Chicago Title Company | |
| Ridolfi Michael D | -- | None Available | |
| Ridolfi Mike | $357,500 | Chicago Title Company | |
| Td Usa Investment Inc | $271,100 | None Available | |
| Kakkar Neelam | -- | -- |
Source: Public Records
Mortgage History
| Date | Status | Borrower | Loan Amount |
|---|---|---|---|
| Previous Owner | Ridolfi Mike | $286,000 |
Source: Public Records
Tax History Compared to Growth
Tax History
| Year | Tax Paid | Tax Assessment Tax Assessment Total Assessment is a certain percentage of the fair market value that is determined by local assessors to be the total taxable value of land and additions on the property. | Land | Improvement |
|---|---|---|---|---|
| 2025 | $4,743 | $323,265 | $131,780 | $198,485 |
| 2024 | $4,743 | $316,789 | $129,196 | $194,593 |
| 2023 | $4,657 | $317,441 | $126,663 | $190,778 |
| 2022 | $4,575 | $304,217 | $124,179 | $187,038 |
| 2021 | $4,471 | $298,116 | $121,745 | $183,371 |
| 2020 | $4,329 | $301,990 | $120,498 | $181,492 |
| 2019 | $4,351 | $296,068 | $118,135 | $177,933 |
| 2018 | $5,545 | $402,530 | $120,759 | $281,771 |
| 2017 | $5,396 | $394,640 | $118,392 | $276,248 |
| 2016 | $5,186 | $386,904 | $116,071 | $270,833 |
| 2015 | $4,870 | $381,094 | $114,328 | $266,766 |
| 2014 | $4,783 | $373,630 | $112,089 | $261,541 |
Source: Public Records
Map
Nearby Homes
- 1806 Bluebell Dr
- 1688 Bluebell Dr
- 5179 Crocus Way
- 2135 Bluebell Dr
- 2013 Galloway Common
- 1370 Daisy Ln
- 1464 Columbine Way
- 1981 Monterey Dr
- 1333 Daisy Ln
- 2035 Monterey Dr
- 1304 Heather Ln
- 1241 Hibiscus Way
- 4831 Zinnia Ct
- 1479 Spring Valley Common
- 1031 Spring Valley Common
- 5740 Woodrose Way
- 814 Sundial Cir Unit 105
- 5801 Flora Common
- 5473 Rainflower Dr
- 734 Bellflower St
- 4725 Capriconus Ave
- 4709 Capriconus Ave
- 4734 Scenic Ave
- 4712 Scenic Ave
- 4756 Scenic Ave
- 4767 Capriconus Ave
- 4714 Aries Ct
- 1881 Bluebell Dr
- 4778 Scenic Ave
- 4726 Aries Ct
- 4781 Capriconus Ave
- 1899 Bluebell Dr
- 4790 Scenic Ave
- 1864 Galaxy Ct
- 4794 Aries Ct
- 1812 Galaxy Ct
- 4715 Scenic Ave
- 1876 Bluebell Dr
- 4749 Scenic Ave
- 4738 Aries Ct