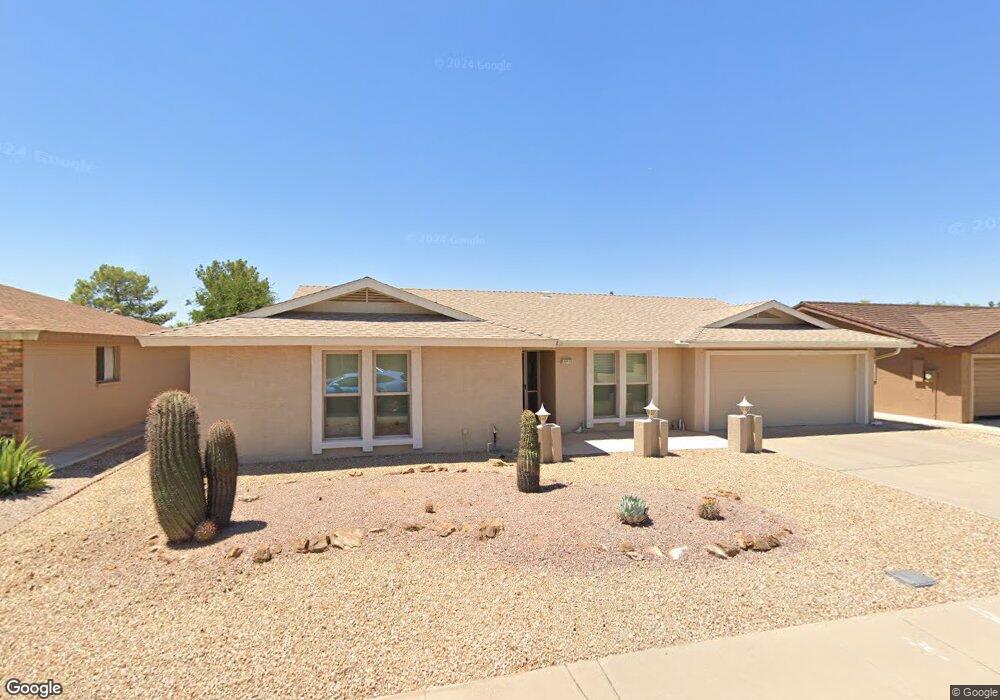
4713 E Flower Cir Mesa, AZ 85206
Sunland Village NeighborhoodEstimated Value: $341,000 - $424,000
3
Beds
3
Baths
1,942
Sq Ft
$201/Sq Ft
Est. Value
About This Home
This home is located at 4713 E Flower Cir, Mesa, AZ 85206 and is currently estimated at $391,003, approximately $201 per square foot. 4713 E Flower Cir is a home located in Maricopa County with nearby schools including Franklin at Brimhall Elementary School, Madison Elementary School, and Franklin West Elementary School.
Ownership History
Date
Name
Owned For
Owner Type
Purchase Details
Closed on
Aug 29, 2024
Sold by
Tammy Tiede Trust and Tiede Tammy
Bought by
Hughes Patrick D and Hughes Debra S
Current Estimated Value
Home Financials for this Owner
Home Financials are based on the most recent Mortgage that was taken out on this home.
Original Mortgage
$125,000
Outstanding Balance
$123,673
Interest Rate
6.77%
Mortgage Type
New Conventional
Estimated Equity
$267,330
Purchase Details
Closed on
Sep 1, 2022
Sold by
Tiede Tammy Jean
Bought by
Tammy Tiede Trust
Purchase Details
Closed on
Apr 28, 2008
Sold by
Piper Gerald D
Bought by
Tiede Tammy Jean
Purchase Details
Closed on
Oct 28, 1998
Sold by
Piper Gerald D
Bought by
Piper Gerald D
Purchase Details
Closed on
Oct 27, 1998
Sold by
Piper Gerald D and Piper Lois K
Bought by
Piper Gerald D
Purchase Details
Closed on
Mar 4, 1997
Sold by
Kelly Ellen W
Bought by
Piper Gerald D and Piper Lois K
Create a Home Valuation Report for This Property
The Home Valuation Report is an in-depth analysis detailing your home's value as well as a comparison with similar homes in the area
Home Values in the Area
Average Home Value in this Area
Purchase History
| Date | Buyer | Sale Price | Title Company |
|---|---|---|---|
| Hughes Patrick D | $390,000 | Pioneer Title Agency | |
| Tammy Tiede Trust | -- | -- | |
| Tammy Tiede Trust | -- | -- | |
| Tiede Tammy Jean | -- | None Available | |
| Piper Gerald D | -- | -- | |
| Piper Gerald D | -- | -- | |
| Piper Gerald D | $122,500 | Nations Title Insurance |
Source: Public Records
Mortgage History
| Date | Status | Borrower | Loan Amount |
|---|---|---|---|
| Open | Hughes Patrick D | $125,000 |
Source: Public Records
Tax History
| Year | Tax Paid | Tax Assessment Tax Assessment Total Assessment is a certain percentage of the fair market value that is determined by local assessors to be the total taxable value of land and additions on the property. | Land | Improvement |
|---|---|---|---|---|
| 2025 | $2,195 | $21,843 | -- | -- |
| 2024 | $1,874 | $20,803 | -- | -- |
| 2023 | $1,874 | $29,400 | $5,880 | $23,520 |
| 2022 | $1,834 | $24,280 | $4,850 | $19,430 |
| 2021 | $1,876 | $20,550 | $4,110 | $16,440 |
| 2020 | $1,850 | $19,950 | $3,990 | $15,960 |
| 2019 | $1,716 | $18,630 | $3,720 | $14,910 |
| 2018 | $1,637 | $17,360 | $3,470 | $13,890 |
| 2017 | $1,587 | $16,530 | $3,300 | $13,230 |
| 2016 | $1,557 | $16,280 | $3,250 | $13,030 |
| 2015 | $1,468 | $14,800 | $2,960 | $11,840 |
Source: Public Records
Map
Nearby Homes
- 4734 E Florian Cir
- 4719 E Flossmoor Cir
- 4648 E Florian Ave
- 1025 S Roanoke
- 955 S Rochester
- 4647 E Garnet Cir
- 913 S Roanoke
- 4749 E Edgewood Ave
- 4709 E Edgewood Ave
- 829 S Roanoke
- 1155 S St Paul --
- 4654 E Escondido Ave
- 4557 E Grove Ave
- 1021 S Greenfield Rd Unit 1195
- 1021 S Greenfield Rd Unit 1045
- 1021 S Greenfield Rd Unit 1194
- 1021 S Greenfield Rd Unit 1080
- 1021 S Greenfield Rd Unit 1106
- 4632 E Escondido Ave
- 4539 E Grove Ave
- 4721 E Flower Cir
- 4705 E Flower Cir
- 1105 S Quail
- 1113 S Quail
- 1125 S Quail
- 1133 S Quail
- 4712 E Flossmoor Cir
- 1141 S Quail
- 4704 E Flossmoor Cir
- 4729 E Flower Cir
- 4714 E Flower Cir
- 4706 E Flower Cir
- 4722 E Flower Cir
- 4732 E Flossmoor Cir
- 4661 E Flower Ave
- 4737 E Flower Cir
- 4730 E Flower Cir
- 1140 S Quail
- 4744 E Flossmoor Cir
- 4662 E Flower Ave
Your Personal Tour Guide
Ask me questions while you tour the home.