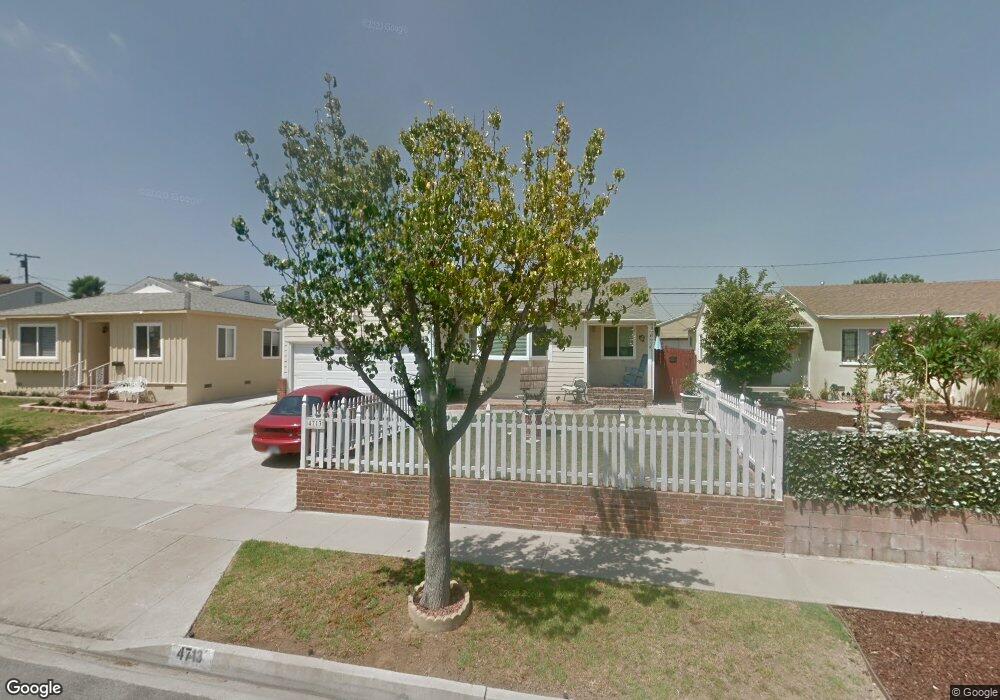
4713 Paramount Blvd Lakewood, CA 90712
Lakewood Mutual NeighborhoodEstimated Value: $798,000 - $842,202
2
Beds
1
Bath
1,027
Sq Ft
$789/Sq Ft
Est. Value
About This Home
This home is located at 4713 Paramount Blvd, Lakewood, CA 90712 and is currently estimated at $810,801, approximately $789 per square foot. 4713 Paramount Blvd is a home located in Los Angeles County with nearby schools including Riley Elementary School, Hoover Middle School, and Lakewood High School.
Ownership History
Date
Name
Owned For
Owner Type
Purchase Details
Closed on
Feb 25, 2000
Sold by
Va
Bought by
James Charles W
Current Estimated Value
Purchase Details
Closed on
Oct 31, 1995
Sold by
Chavez Ruben N
Bought by
Willeford Lonnie and Willeford Cynthia
Home Financials for this Owner
Home Financials are based on the most recent Mortgage that was taken out on this home.
Original Mortgage
$156,500
Interest Rate
7.47%
Mortgage Type
VA
Create a Home Valuation Report for This Property
The Home Valuation Report is an in-depth analysis detailing your home's value as well as a comparison with similar homes in the area
Home Values in the Area
Average Home Value in this Area
Purchase History
| Date | Buyer | Sale Price | Title Company |
|---|---|---|---|
| James Charles W | -- | Commonwealth Title | |
| Willeford Lonnie | $156,500 | Provident Title |
Source: Public Records
Mortgage History
| Date | Status | Borrower | Loan Amount |
|---|---|---|---|
| Previous Owner | Willeford Lonnie | $156,500 |
Source: Public Records
Tax History Compared to Growth
Tax History
| Year | Tax Paid | Tax Assessment Tax Assessment Total Assessment is a certain percentage of the fair market value that is determined by local assessors to be the total taxable value of land and additions on the property. | Land | Improvement |
|---|---|---|---|---|
| 2025 | $3,676 | $259,960 | $171,097 | $88,863 |
| 2024 | $3,676 | $254,864 | $167,743 | $87,121 |
| 2023 | $3,613 | $249,867 | $164,454 | $85,413 |
| 2022 | $3,404 | $244,969 | $161,230 | $83,739 |
| 2021 | $3,333 | $240,167 | $158,069 | $82,098 |
| 2019 | $3,282 | $233,046 | $153,382 | $79,664 |
| 2018 | $3,114 | $228,477 | $150,375 | $78,102 |
| 2017 | $54 | $223,998 | $147,427 | $76,571 |
| 2016 | $2,868 | $219,607 | $144,537 | $75,070 |
| 2015 | $2,761 | $216,309 | $142,366 | $73,943 |
| 2014 | $2,745 | $212,073 | $139,578 | $72,495 |
Source: Public Records
Map
Nearby Homes
- 4749 Pixie Ave
- 2523 Allred St
- 2803 Frankel St
- 4700 Clair Del Ave Unit 649
- 4700 Clair Del Ave Unit 620
- 2917 Del Amo Blvd
- 2837 Flangel St
- 4340 Pixie Ave
- 2212 Lark Bay Ln
- 4322 Maybank Ave
- 4328 Deeboyar Ave
- 3237 Del Amo Blvd
- 3530 Allred St
- 4223 Pixie Ave
- 5268 Deeboyar Ave
- 1715 E Silva St
- 3638 Sandwood St
- 4113 Brock Ave
- 4944 Coke Ave
- 4425 Walnut Ave
- 4717 Paramount Blvd
- 4707 Paramount Blvd
- 4738 Maybank Ave
- 4723 Paramount Blvd
- 4703 Paramount Blvd
- 4744 Maybank Ave
- 4734 Maybank Ave
- 4728 Maybank Ave
- 4727 Paramount Blvd
- 4754 Maybank Ave
- 4724 Maybank Ave
- 4733 Paramount Blvd
- 4645 Paramount Blvd
- 4758 Maybank Ave
- 4718 Maybank Ave
- 4737 Paramount Blvd
- 4641 Paramount Blvd
- 4739 Maybank Ave
- 4743 Maybank Ave
- 4733 Maybank Ave