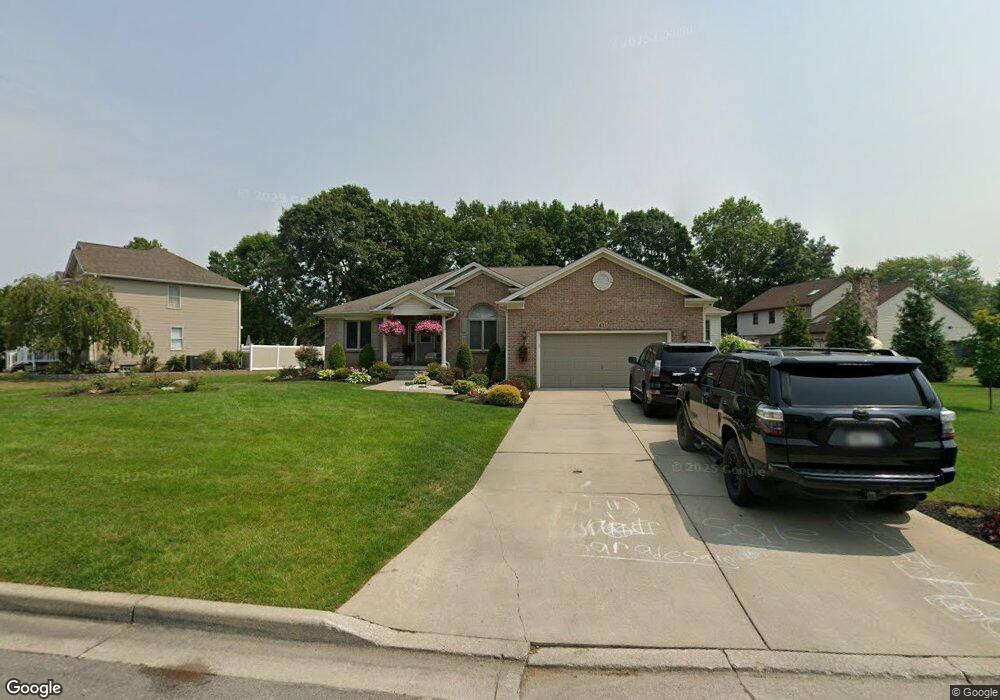
4713 Perry Ct Lewiston, NY 14092
Estimated Value: $440,000 - $577,000
3
Beds
3
Baths
2,100
Sq Ft
$242/Sq Ft
Est. Value
About This Home
This home is located at 4713 Perry Ct, Lewiston, NY 14092 and is currently estimated at $507,544, approximately $241 per square foot. 4713 Perry Ct is a home located in Niagara County with nearby schools including Primary Education Center, Intermediate Education Center, and Lewiston Porter Middle School.
Ownership History
Date
Name
Owned For
Owner Type
Purchase Details
Closed on
Aug 31, 2023
Sold by
Witkowski Donna and Witkowski Stephen J
Bought by
Witkowski Donna
Current Estimated Value
Purchase Details
Closed on
Feb 18, 2017
Sold by
Carosella Joseph W
Bought by
Witkowski Donna
Purchase Details
Closed on
Aug 15, 2005
Sold by
Talarico Bros Building Corp
Bought by
Witkowski Donna
Purchase Details
Closed on
Aug 12, 2004
Sold by
Lewiston Development Corp
Bought by
Talarico Bros Building Corp
Create a Home Valuation Report for This Property
The Home Valuation Report is an in-depth analysis detailing your home's value as well as a comparison with similar homes in the area
Home Values in the Area
Average Home Value in this Area
Purchase History
| Date | Buyer | Sale Price | Title Company |
|---|---|---|---|
| Witkowski Donna | -- | None Listed On Document | |
| Witkowski Donna | -- | None Available | |
| Witkowski Donna | $232,000 | Joseph W Carosella | |
| Talarico Bros Building Corp | $34,000 | David Boniello |
Source: Public Records
Tax History
| Year | Tax Paid | Tax Assessment Tax Assessment Total Assessment is a certain percentage of the fair market value that is determined by local assessors to be the total taxable value of land and additions on the property. | Land | Improvement |
|---|---|---|---|---|
| 2024 | $7,835 | $200,500 | $34,000 | $166,500 |
| 2023 | $8,790 | $200,500 | $34,000 | $166,500 |
| 2022 | $8,830 | $200,500 | $34,000 | $166,500 |
| 2021 | $8,736 | $200,500 | $34,000 | $166,500 |
| 2020 | $4,947 | $200,500 | $34,000 | $166,500 |
| 2019 | $3,334 | $200,500 | $34,000 | $166,500 |
| 2018 | $5,878 | $200,500 | $34,000 | $166,500 |
| 2017 | $3,334 | $200,500 | $34,000 | $166,500 |
| 2016 | $6,982 | $200,500 | $34,000 | $166,500 |
| 2015 | -- | $200,500 | $34,000 | $166,500 |
| 2014 | -- | $200,500 | $34,000 | $166,500 |
Source: Public Records
Map
Nearby Homes
- 720 Raymond Dr
- 611 Sandlewood Dr
- 4628 Creek Rd
- 4822 E Eddy Dr
- Lot 38 Eddy Dr W
- Lot 36 Eddy Dr W
- 588 Oak Run Dr
- 0 Creek Rd
- 715 Hillview Ct
- 427 Cherry Ln
- 403 Morgan Dr
- 490 Ridge St
- 933 Creek Road Extension
- 750 Tuscarora St
- 1014 Little Vista Dr
- 4951 Big Vista Dr
- 0 S 5th St
- 250 S 2nd St
- 345 S 4th St
- 5151 Bridle Path Ln
Your Personal Tour Guide
Ask me questions while you tour the home.