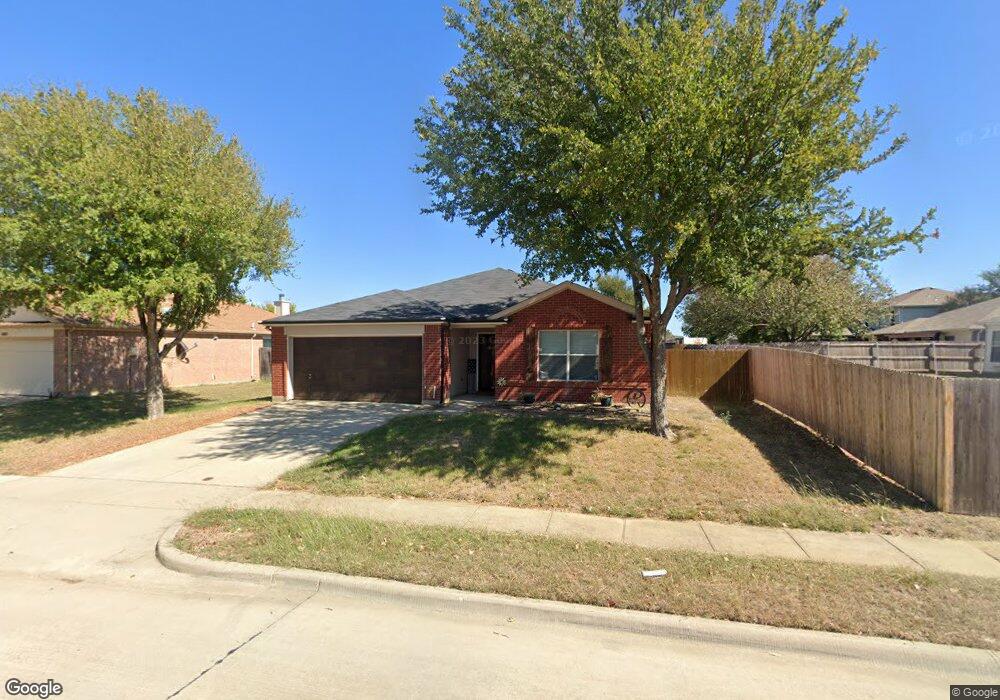
4713 Provence Dr Argyle, TX 76226
Estimated Value: $289,976 - $311,000
3
Beds
2
Baths
1,397
Sq Ft
$213/Sq Ft
Est. Value
About This Home
This home is located at 4713 Provence Dr, Argyle, TX 76226 and is currently estimated at $297,744, approximately $213 per square foot. 4713 Provence Dr is a home located in Denton County with nearby schools including Borman Elementary School, McMath Middle School, and Denton High School.
Ownership History
Date
Name
Owned For
Owner Type
Purchase Details
Closed on
Jun 30, 2020
Sold by
Spillman George R and Spillman Karyn H
Bought by
Ransom Micahle Rose and Ransom Jaimie Rae
Current Estimated Value
Home Financials for this Owner
Home Financials are based on the most recent Mortgage that was taken out on this home.
Original Mortgage
$167,200
Outstanding Balance
$148,537
Interest Rate
3.2%
Mortgage Type
Unknown
Estimated Equity
$149,207
Purchase Details
Closed on
May 21, 2015
Sold by
Solomon Brian and Robertson Rachel
Bought by
Spillman George R and Spillman Karyn H
Home Financials for this Owner
Home Financials are based on the most recent Mortgage that was taken out on this home.
Original Mortgage
$116,000
Interest Rate
3.68%
Mortgage Type
New Conventional
Purchase Details
Closed on
Mar 31, 2003
Sold by
Pulte Homes Of Texas Lp
Bought by
Solomon Brian and Robertson Rachel
Home Financials for this Owner
Home Financials are based on the most recent Mortgage that was taken out on this home.
Original Mortgage
$120,835
Interest Rate
5.77%
Mortgage Type
FHA
Create a Home Valuation Report for This Property
The Home Valuation Report is an in-depth analysis detailing your home's value as well as a comparison with similar homes in the area
Purchase History
| Date | Buyer | Sale Price | Title Company |
|---|---|---|---|
| Ransom Micahle Rose | -- | None Available | |
| Spillman George R | -- | None Available | |
| Solomon Brian | -- | -- |
Source: Public Records
Mortgage History
| Date | Status | Borrower | Loan Amount |
|---|---|---|---|
| Open | Ransom Micahle Rose | $167,200 | |
| Previous Owner | Spillman George R | $116,000 | |
| Previous Owner | Solomon Brian | $120,835 |
Source: Public Records
Tax History
| Year | Tax Paid | Tax Assessment Tax Assessment Total Assessment is a certain percentage of the fair market value that is determined by local assessors to be the total taxable value of land and additions on the property. | Land | Improvement |
|---|---|---|---|---|
| 2025 | $3,985 | $276,598 | $75,391 | $201,207 |
| 2024 | $5,180 | $268,375 | $0 | $0 |
| 2023 | $3,462 | $243,977 | $75,391 | $207,620 |
| 2022 | $4,708 | $221,797 | $56,543 | $183,292 |
| 2021 | $4,482 | $201,634 | $56,543 | $145,091 |
| 2020 | $4,354 | $190,464 | $56,543 | $133,921 |
| 2019 | $4,366 | $183,000 | $56,543 | $126,457 |
| 2018 | $4,155 | $172,000 | $56,543 | $115,457 |
| 2017 | $3,870 | $156,578 | $56,543 | $100,035 |
| 2016 | $3,444 | $139,346 | $29,306 | $110,040 |
| 2015 | $2,487 | $121,000 | $29,306 | $97,269 |
| 2014 | $2,487 | $110,000 | $25,642 | $84,358 |
| 2013 | -- | $105,036 | $25,642 | $79,394 |
Source: Public Records
Map
Nearby Homes
- 4005 Tuscany Ct
- 3901 Tuscany Ct
- 4201 Vinyard Way
- 3616 Riesling Dr
- 4520 Shagbark Dr
- 3305 Emerald Trace Dr
- 3301 Emerald Trace Dr
- 3300 Emerald Trace Dr
- 3212 Emerald Trace Dr
- 3208 Emerald Trace Dr
- 3205 Emerald Trace Dr
- 3204 Emerald Trace Dr
- 3200 Emerald Trace Dr
- 3004 Emerald Trace Dr
- 4715 Bonnie Brae St
- 5800 Bull Creek Ln
- 3816 Canyon Verde Ln
- 2900 Emerald Trace Dr
- 5824 Harvey Gap Ln
- 2808 Parkwood Cir
- 4709 Provence Dr
- 4108 Sonoma Dr
- 4104 Sonoma Dr
- 4013 Tuscany Ct
- 4705 Provence Dr
- 4100 Sonoma Dr
- 4009 Tuscany Ct
- 4708 Provence Dr
- 4200 Sonoma Dr
- 4008 Sonoma Dr
- 4012 Tuscany Ct
- 4704 Provence Dr
- 4701 Provence Dr
- 4204 Sonoma Dr
- 4004 Sonoma Dr
- 4700 Provence Dr
- 4008 Tuscany Ct
- 4109 Sonoma Dr
- 4613 Provence Dr
- 4105 Sonoma Dr
Your Personal Tour Guide
Ask me questions while you tour the home.