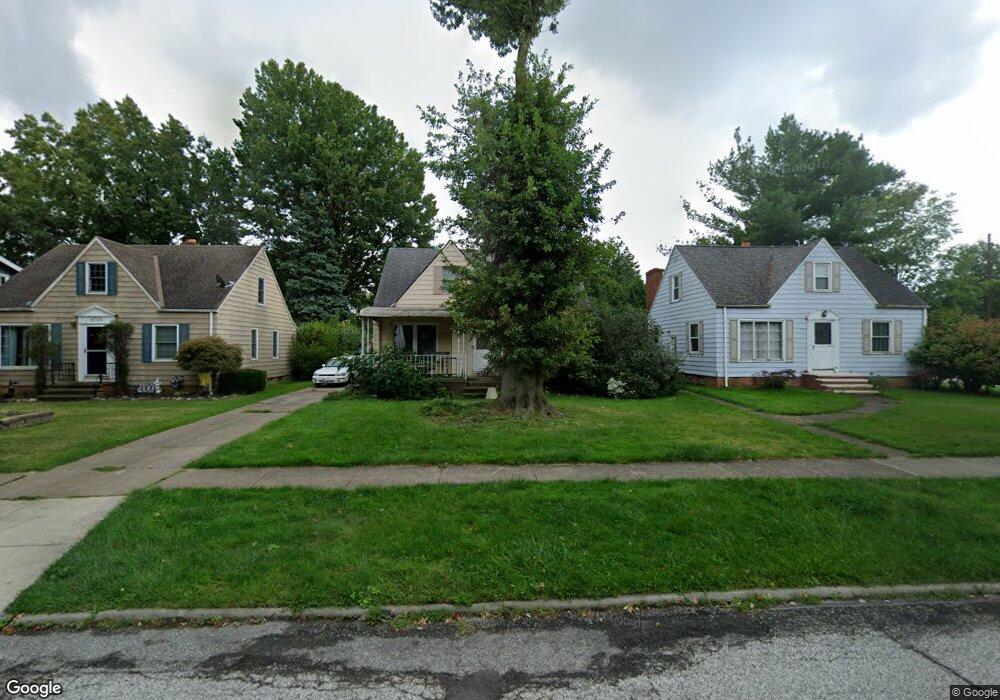
4713 Sheraton Dr Cleveland, OH 44134
Estimated Value: $124,487 - $208,000
3
Beds
1
Bath
1,499
Sq Ft
$107/Sq Ft
Est. Value
About This Home
This home is located at 4713 Sheraton Dr, Cleveland, OH 44134 and is currently estimated at $159,829, approximately $106 per square foot. 4713 Sheraton Dr is a home located in Cuyahoga County with nearby schools including Shiloh Middle School, Parma High School, and St Charles School.
Ownership History
Date
Name
Owned For
Owner Type
Purchase Details
Closed on
Sep 26, 2025
Sold by
Quest Property Holdings Llc
Bought by
Rp3 Funding Llc
Current Estimated Value
Purchase Details
Closed on
Jul 7, 2025
Sold by
Schindler Keith and Schindler Nicole
Bought by
Quest Property Holdings Llc
Purchase Details
Closed on
May 19, 2016
Sold by
Schindler Carrie Ann and Schindler Keith Jonathan
Bought by
Schindler Warren Alexander
Purchase Details
Closed on
Jul 1, 2003
Sold by
Schindler Warren Alexander
Bought by
Schindler Carrie Ann and Schindler Keith Jonathan
Purchase Details
Closed on
Apr 6, 1999
Sold by
Schindler Anne Kathyrn
Bought by
Schindler Warren A
Purchase Details
Closed on
Jul 5, 1991
Sold by
Schindler Walter A and Schindler Anne
Bought by
Schindler Anne
Purchase Details
Closed on
Jan 1, 1975
Bought by
Schindler Walter A and Schindler Anne
Create a Home Valuation Report for This Property
The Home Valuation Report is an in-depth analysis detailing your home's value as well as a comparison with similar homes in the area
Home Values in the Area
Average Home Value in this Area
Purchase History
| Date | Buyer | Sale Price | Title Company |
|---|---|---|---|
| Rp3 Funding Llc | $146,850 | Simplifile (Recording Service) | |
| Quest Property Holdings Llc | $110,000 | Nova Title | |
| Schindler Warren Alexander | -- | Attorney | |
| Schindler Carrie Ann | -- | -- | |
| Schindler Warren A | -- | -- | |
| Schindler Anne | -- | -- | |
| Schindler Walter A | -- | -- |
Source: Public Records
Tax History Compared to Growth
Tax History
| Year | Tax Paid | Tax Assessment Tax Assessment Total Assessment is a certain percentage of the fair market value that is determined by local assessors to be the total taxable value of land and additions on the property. | Land | Improvement |
|---|---|---|---|---|
| 2024 | $2,721 | $52,500 | $13,195 | $39,305 |
| 2023 | $2,759 | $47,150 | $10,470 | $36,680 |
| 2022 | $2,758 | $47,150 | $10,470 | $36,680 |
| 2021 | $3,486 | $47,150 | $10,470 | $36,680 |
| 2020 | $3,050 | $36,260 | $8,050 | $28,210 |
| 2019 | $2,926 | $103,600 | $23,000 | $80,600 |
| 2018 | $2,551 | $36,260 | $8,050 | $28,210 |
| 2017 | $2,373 | $26,740 | $6,300 | $20,440 |
| 2016 | $2,307 | $26,740 | $6,300 | $20,440 |
| 2015 | $2,160 | $26,740 | $6,300 | $20,440 |
| 2014 | $2,305 | $28,740 | $6,790 | $21,950 |
Source: Public Records
Map
Nearby Homes
- 4424 Forestwood Dr
- 4710 Maplecrest Ave
- 4002 Maplecrest Ave
- 5603 Allanwood Dr
- 5815 Wilber Ave
- 4802 Grantwood Dr
- 3436 Heresford Dr
- 5212 Wood Ave
- 3910 Wood Ave
- 6021 Snow Rd
- 4507 Grantwood Dr
- 4005 Pershing Ave
- 4000 Pershing Ave
- 4420 Torrington Ave
- 5000 Torrington Ave
- 4409 Milford Ave
- 5521 W 48th St
- 6189 W 54th St
- 5205 Woodrow Ave
- 5914 Forest Ave
- 4719 Sheraton Dr
- 4709 Sheraton Dr
- 4703 Sheraton Dr
- 4619 Sheraton Dr
- 4712 Forestwood Dr
- 4718 Forestwood Dr
- 4702 Forestwood Dr
- 4613 Sheraton Dr
- 4618 Forestwood Dr
- 4712 Sheraton Dr
- 4708 Sheraton Dr
- 4609 Sheraton Dr
- 4702 Sheraton Dr
- 4612 Forestwood Dr
- 4804 Sheraton Dr
- 4618 Sheraton Dr
- 4603 Sheraton Dr
- 4608 Forestwood Dr
- 4612 Sheraton Dr
- 4810 Sheraton Dr