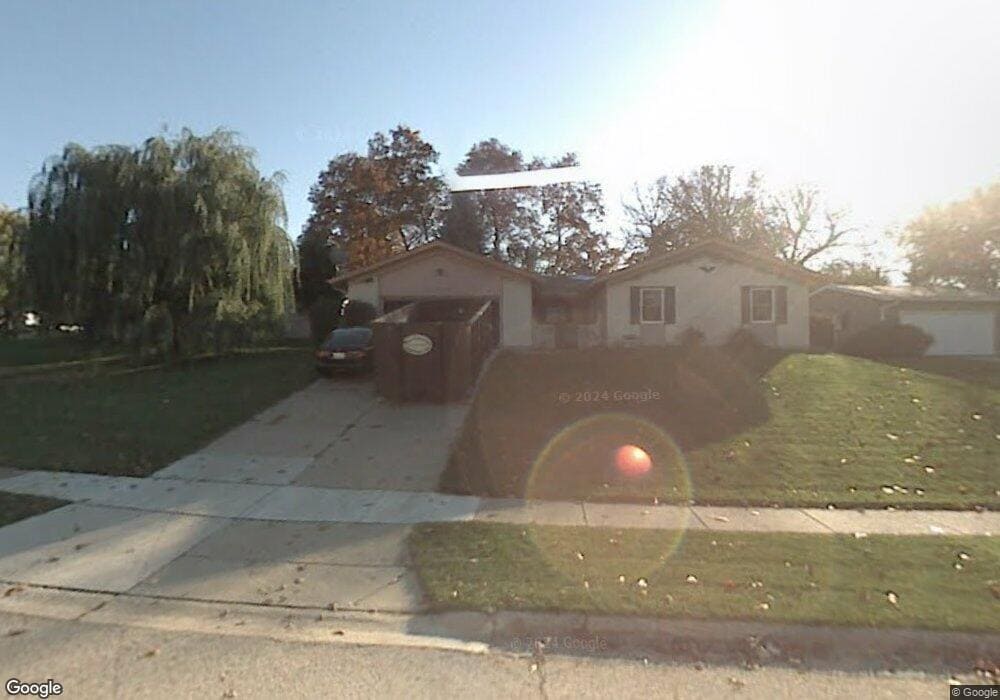
4713 W Cumberland Cir McHenry, IL 60050
Estimated Value: $306,770 - $328,000
3
Beds
2
Baths
1,600
Sq Ft
$199/Sq Ft
Est. Value
About This Home
This home is located at 4713 W Cumberland Cir, McHenry, IL 60050 and is currently estimated at $318,693, approximately $199 per square foot. 4713 W Cumberland Cir is a home located in McHenry County with nearby schools including Riverwood Elementary School, Parkland School, and McHenry Community High School - Upper Campus.
Ownership History
Date
Name
Owned For
Owner Type
Purchase Details
Closed on
Jun 23, 2021
Sold by
Kusch Jacqueline B
Bought by
Lenitno Bryana M and Lenitno Charles
Current Estimated Value
Home Financials for this Owner
Home Financials are based on the most recent Mortgage that was taken out on this home.
Original Mortgage
$6,000
Outstanding Balance
$5,432
Interest Rate
2.9%
Mortgage Type
Stand Alone Second
Estimated Equity
$313,261
Purchase Details
Closed on
Jun 27, 2008
Sold by
Simon Jeremy E
Bought by
Kusch Earl W and Kusch Jacqueline B
Home Financials for this Owner
Home Financials are based on the most recent Mortgage that was taken out on this home.
Original Mortgage
$195,032
Interest Rate
6.1%
Mortgage Type
FHA
Purchase Details
Closed on
Sep 14, 2006
Sold by
Balun Theodore G and Balun Agnes T
Bought by
Simon Jeremy E
Home Financials for this Owner
Home Financials are based on the most recent Mortgage that was taken out on this home.
Original Mortgage
$156,000
Interest Rate
6.59%
Mortgage Type
Unknown
Create a Home Valuation Report for This Property
The Home Valuation Report is an in-depth analysis detailing your home's value as well as a comparison with similar homes in the area
Home Values in the Area
Average Home Value in this Area
Purchase History
| Date | Buyer | Sale Price | Title Company |
|---|---|---|---|
| Lenitno Bryana M | $228,000 | None Available | |
| Kusch Earl W | $213,500 | Heritage Title Company | |
| Simon Jeremy E | $195,000 | Fatic |
Source: Public Records
Mortgage History
| Date | Status | Borrower | Loan Amount |
|---|---|---|---|
| Open | Lenitno Bryana M | $6,000 | |
| Previous Owner | Kusch Earl W | $195,032 | |
| Previous Owner | Simon Jeremy E | $156,000 |
Source: Public Records
Tax History Compared to Growth
Tax History
| Year | Tax Paid | Tax Assessment Tax Assessment Total Assessment is a certain percentage of the fair market value that is determined by local assessors to be the total taxable value of land and additions on the property. | Land | Improvement |
|---|---|---|---|---|
| 2024 | $5,969 | $78,557 | $14,554 | $64,003 |
| 2023 | $5,762 | $70,379 | $13,039 | $57,340 |
| 2022 | $5,632 | $65,293 | $12,097 | $53,196 |
| 2021 | $4,873 | $60,806 | $11,266 | $49,540 |
| 2020 | $4,681 | $58,271 | $10,796 | $47,475 |
| 2019 | $4,403 | $53,694 | $10,277 | $43,417 |
| 2018 | $2,990 | $45,853 | $9,811 | $36,042 |
| 2017 | $3,080 | $43,034 | $9,208 | $33,826 |
| 2016 | $3,209 | $40,219 | $8,606 | $31,613 |
| 2013 | -- | $38,382 | $8,473 | $29,909 |
Source: Public Records
Map
Nearby Homes
- 4718 W Cumberland Cir
- 4621 Bonner Dr
- 1320 Meadow Ln
- 4604 Sussex Dr
- 4602 W Northfox Ln Unit 7
- 1514 N North Ave
- 4618 W Northfox Ln Unit 6
- 915 Royal Dr Unit 2
- 1607 Lakeland Ave
- 5101 W Elm St
- 4913 W Oakwood Dr Unit B
- 4708 Willow Ln
- 4910 Willow Ln
- 5014 Willow Ln
- 4104 W Elm St
- 5107 Willow Ln Unit 3
- 1807 Beach Rd
- 3012 Justen Ln
- 607 Silbury Ct
- 1911 Highview Ave
- 4709 W Cumberland Cir
- 4717 W Cumberland Cir
- 4710 Ashley Dr
- 4708 Ashley Dr
- 4714 W Cumberland Cir
- 4719 W Cumberland Cir
- 4716 W Cumberland Cir
- 4711 Ashley Dr
- 4712 W Cumberland Cir
- 4710 W Cumberland Cir
- 4708 W Cumberland Cir
- 1122 N Cumberland Cir
- 4706 W Cumberland Cir
- 4713 Ashley Dr
- 1120 N Cumberland Cir
- 4707 Ashley Dr
- 4704 Ashley Dr
- 4722 W Cumberland Cir
- 1118 N Cumberland Cir
- 4615 Sussex Dr