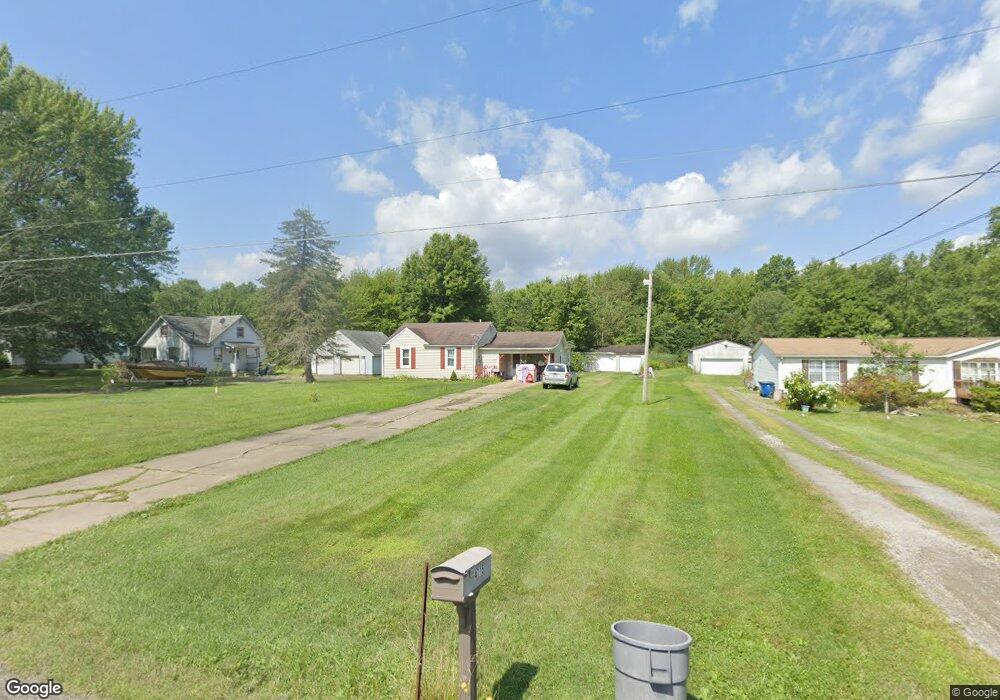
4714 Palmyra Rd SW Warren, OH 44481
Estimated Value: $119,859 - $162,000
3
Beds
1
Bath
1,056
Sq Ft
$133/Sq Ft
Est. Value
About This Home
This home is located at 4714 Palmyra Rd SW, Warren, OH 44481 and is currently estimated at $139,965, approximately $132 per square foot. 4714 Palmyra Rd SW is a home located in Trumbull County with nearby schools including Lordstown Elementary School and Lordstown High School.
Ownership History
Date
Name
Owned For
Owner Type
Purchase Details
Closed on
Aug 30, 2010
Sold by
Secretary Of Housing & Urban Development
Bought by
Rios Dean A
Current Estimated Value
Home Financials for this Owner
Home Financials are based on the most recent Mortgage that was taken out on this home.
Original Mortgage
$35,500
Outstanding Balance
$23,948
Interest Rate
4.87%
Mortgage Type
FHA
Estimated Equity
$116,017
Purchase Details
Closed on
Dec 4, 2009
Sold by
Bac Home Loans Servicing Lp
Bought by
The Secretary Of Housing & Urban Develop
Purchase Details
Closed on
Apr 15, 2005
Sold by
Rios Dean A and Rios Diana L
Bought by
Richmond Joshua T
Home Financials for this Owner
Home Financials are based on the most recent Mortgage that was taken out on this home.
Original Mortgage
$73,348
Interest Rate
5.88%
Mortgage Type
FHA
Purchase Details
Closed on
Jan 1, 1990
Bought by
Dean A Rios
Create a Home Valuation Report for This Property
The Home Valuation Report is an in-depth analysis detailing your home's value as well as a comparison with similar homes in the area
Home Values in the Area
Average Home Value in this Area
Purchase History
| Date | Buyer | Sale Price | Title Company |
|---|---|---|---|
| Rios Dean A | $36,000 | Attorney | |
| The Secretary Of Housing & Urban Develop | -- | Attorney | |
| Bac Home Loans Servicing Lp | $80,396 | None Available | |
| Richmond Joshua T | $74,500 | -- | |
| Dean A Rios | -- | -- |
Source: Public Records
Mortgage History
| Date | Status | Borrower | Loan Amount |
|---|---|---|---|
| Open | Rios Dean A | $35,500 | |
| Previous Owner | Richmond Joshua T | $73,348 |
Source: Public Records
Tax History Compared to Growth
Tax History
| Year | Tax Paid | Tax Assessment Tax Assessment Total Assessment is a certain percentage of the fair market value that is determined by local assessors to be the total taxable value of land and additions on the property. | Land | Improvement |
|---|---|---|---|---|
| 2024 | $1,821 | $28,490 | $6,090 | $22,400 |
| 2023 | $1,702 | $28,490 | $6,090 | $22,400 |
| 2022 | $1,174 | $21,910 | $5,600 | $16,310 |
| 2021 | $1,177 | $21,910 | $5,600 | $16,310 |
| 2020 | $1,042 | $21,910 | $5,600 | $16,310 |
| 2019 | $1,141 | $20,020 | $5,180 | $14,840 |
| 2018 | $1,205 | $20,020 | $5,180 | $14,840 |
| 2017 | $1,276 | $20,020 | $5,180 | $14,840 |
| 2016 | $1,231 | $19,470 | $5,150 | $14,320 |
| 2015 | $1,180 | $19,470 | $5,150 | $14,320 |
| 2014 | $1,293 | $19,470 | $5,150 | $14,320 |
| 2013 | $1,214 | $20,060 | $5,150 | $14,910 |
Source: Public Records
Map
Nearby Homes
- 0 Palmyra Rd Unit 5011339
- 3267 S Leavitt Rd SW
- 1672 Rustic Run Rd SW
- 1761 Rustic Run Rd SW
- 1005 Ellsworth Bailey Rd SW
- 0 State Route 45 Unit 4489118
- 2822 Selkirk Bush Rd SW
- 0 Carson Salt Springs Rd Unit 5020212
- 0 Layer Rd
- 1863 Deerfield Ave SW
- VL Risher Rd
- 1424 Carson Salt Rd
- 2805 Lydia Dr SW
- 2719 Virginia Ave SW
- 0 Lyntz Townline Rd SW Unit 5105704
- 2980 Malibu Dr SW
- 2914 Malibu Dr SW
- 0 Kale Adams Rd SW
- 1164 Kale Adams Rd
- 0 Kings Dr SW
- 4720 Palmyra Rd SW
- 4732 Palmyra Rd SW
- 4750 Palmyra Rd SW
- 4672 Palmyra Rd SW
- 4768 Palmyra Rd SW
- 4715 Palmyra Rd SW
- 4626 Palmyra Rd SW
- 4800 Palmyra Rd SW
- 4606 Palmyra Rd SW
- 4695 Palmyra Rd SW
- 4592 Palmyra Rd SW
- 4779 Palmyra Rd SW
- 4820 Palmyra Rd SW
- 4574 Palmyra Rd SW
- 4811 Palmyra Rd SW
- 4537 Palmyra Rd SW
- 4830 Palmyra Rd SW
- 4823 Palmyra Rd SW
- 4523 Palmyra Rd SW
- 4837 Palmyra Rd SW