K
Seller's Agent in 2022
Kadie Stidham
Orchard Brokerage, LLC
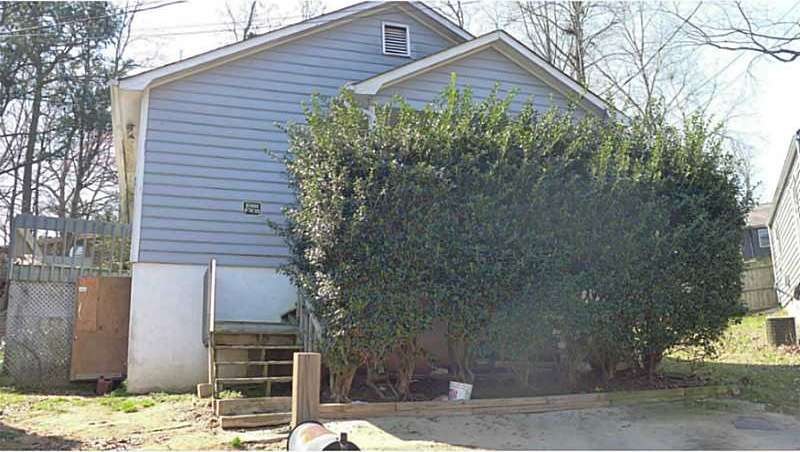
Investor special! Sold 'As-Is' No disclosure.
Last Agent to Sell the Property
RANDY WICKOWSKI
NOT A VALID MEMBER License #304883 Listed on: 03/15/2013
Co-Listed By
RENEE WICKOWSKI
NOT A VALID MEMBER License #273685
Last Buyer's Agent
Suzanne Bernitt
NOT A VALID MEMBER License #208479

Home Type
Est. Annual Taxes
Year Built
Lot Details
Parking
Home Design
Interior Spaces
Bedrooms and Bathrooms
Schools
Community Details
Listing and Financial Details
| Date | Type | Sale Price | Title Company |
|---|---|---|---|
| Warranty Deed | $226,000 | -- | |
| Warranty Deed | $234,200 | -- | |
| Warranty Deed | -- | -- | |
| Warranty Deed | $32,000 | -- | |
| Foreclosure Deed | -- | -- | |
| Deed | $66,500 | -- |
| Date | Status | Loan Amount | Loan Type |
|---|---|---|---|
| Previous Owner | $82,378 | Stand Alone Second | |
| Closed | $0 | FHA |
| Date | Event | Price | Change | Sq Ft Price |
|---|---|---|---|---|
| 10/12/2022 10/12/22 | Sold | $226,000 | -8.5% | $224 / Sq Ft |
| 09/28/2022 09/28/22 | Pending | -- | -- | -- |
| 09/15/2022 09/15/22 | Price Changed | $247,000 | -2.4% | $245 / Sq Ft |
| 09/09/2022 09/09/22 | For Sale | $253,000 | 0.0% | $251 / Sq Ft |
| 09/05/2022 09/05/22 | Pending | -- | -- | -- |
| 08/18/2022 08/18/22 | Price Changed | $253,000 | -1.2% | $251 / Sq Ft |
| 08/04/2022 08/04/22 | Price Changed | $256,000 | -1.9% | $254 / Sq Ft |
| 07/21/2022 07/21/22 | Price Changed | $261,000 | -1.5% | $259 / Sq Ft |
| 06/27/2022 06/27/22 | For Sale | $265,000 | 0.0% | $263 / Sq Ft |
| 06/01/2022 06/01/22 | Pending | -- | -- | -- |
| 05/19/2022 05/19/22 | Price Changed | $265,000 | -1.1% | $263 / Sq Ft |
| 05/05/2022 05/05/22 | Price Changed | $268,000 | -4.3% | $266 / Sq Ft |
| 04/21/2022 04/21/22 | Price Changed | $280,000 | -2.1% | $278 / Sq Ft |
| 04/11/2022 04/11/22 | For Sale | $286,000 | +793.8% | $284 / Sq Ft |
| 04/11/2013 04/11/13 | Sold | $32,000 | 0.0% | $32 / Sq Ft |
| 03/15/2013 03/15/13 | For Sale | $32,000 | -- | $32 / Sq Ft |
| Year | Tax Paid | Tax Assessment Tax Assessment Total Assessment is a certain percentage of the fair market value that is determined by local assessors to be the total taxable value of land and additions on the property. | Land | Improvement |
|---|---|---|---|---|
| 2023 | $1,270 | $88,520 | $19,600 | $68,920 |
| 2022 | $1,000 | $69,720 | $16,000 | $53,720 |
| 2021 | $614 | $42,800 | $8,000 | $34,800 |
| 2020 | $614 | $42,800 | $8,000 | $34,800 |
| 2019 | $303 | $23,400 | $4,000 | $19,400 |
| 2018 | $303 | $23,400 | $4,000 | $19,400 |
| 2016 | $255 | $19,890 | $3,400 | $16,490 |
| 2015 | $279 | $21,040 | $4,000 | $17,040 |
| 2014 | $173 | $12,800 | $3,000 | $9,800 |
K
Seller's Agent in 2022
Kadie Stidham
Orchard Brokerage, LLC
Seller Co-Listing Agent in 2022
Mark DiJohn
Flat Earth Realty
(470) 231-8826
1 in this area
41 Total Sales
Buyer's Agent in 2022
IGOR VAZHENIN
Realty Professionals
(404) 932-2228
1 in this area
41 Total Sales
R
Seller's Agent in 2013
RANDY WICKOWSKI
NOT A VALID MEMBER
R
Seller Co-Listing Agent in 2013
RENEE WICKOWSKI
NOT A VALID MEMBER
S
Buyer's Agent in 2013
Suzanne Bernitt
NOT A VALID MEMBER
Source: First Multiple Listing Service (FMLS)
MLS Number: 5122328
APN: 7-266-214
Disclaimer: Certain information contained herein is derived from information provided by parties other than Homes.com. All information provided is deemed reliable, but is not guaranteed to be accurate and should be independently verified.
![]() Listings identified with the FMLS IDX logo come from FMLS and are held by brokerage firms other than the owner of this website. The listing brokerage is identified in any listing details. Information is deemed reliable but is not guaranteed. If you believe any FMLS listing contains material that infringes your copyrighted work please visit www.fmls.com/dmca to review our DMCA policy and learn how to submit a takedown request. © 2025 First Multiple Listing Service, Inc.
Listings identified with the FMLS IDX logo come from FMLS and are held by brokerage firms other than the owner of this website. The listing brokerage is identified in any listing details. Information is deemed reliable but is not guaranteed. If you believe any FMLS listing contains material that infringes your copyrighted work please visit www.fmls.com/dmca to review our DMCA policy and learn how to submit a takedown request. © 2025 First Multiple Listing Service, Inc.