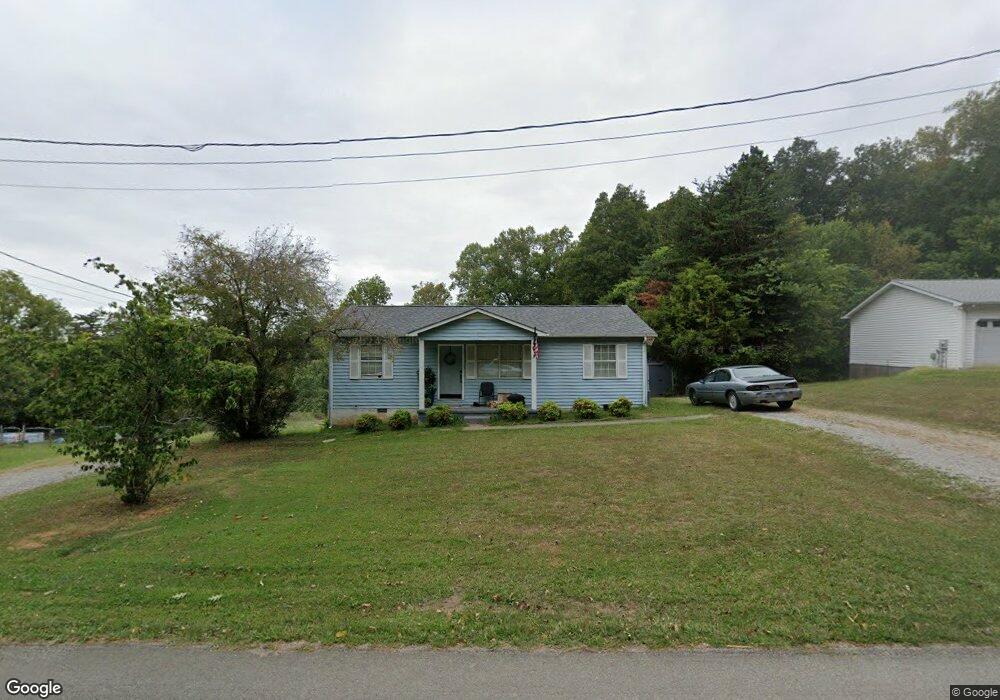
4716 Village Rd Cookeville, TN 38506
Estimated Value: $189,333 - $292,000
--
Bed
2
Baths
1,040
Sq Ft
$221/Sq Ft
Est. Value
About This Home
This home is located at 4716 Village Rd, Cookeville, TN 38506 and is currently estimated at $230,083, approximately $221 per square foot. 4716 Village Rd is a home located in Putnam County with nearby schools including Cookeville High School, Algood Middle School, and Northeast Elementary School.
Ownership History
Date
Name
Owned For
Owner Type
Purchase Details
Closed on
Apr 24, 2003
Sold by
Kim Mills
Bought by
Ryan Slagle Lynn and Ryan Amy R
Current Estimated Value
Home Financials for this Owner
Home Financials are based on the most recent Mortgage that was taken out on this home.
Original Mortgage
$71,900
Outstanding Balance
$31,137
Interest Rate
5.86%
Estimated Equity
$198,946
Purchase Details
Closed on
Nov 26, 2002
Sold by
Thda
Bought by
Kim Mills
Purchase Details
Closed on
Sep 20, 2002
Sold by
Nelson Michael C and Nelson Margie
Bought by
Thda
Purchase Details
Closed on
Sep 17, 2002
Bought by
Tn Housing Dev Agency Suite 1114
Purchase Details
Closed on
May 24, 2000
Sold by
Gambrell Stephen L
Bought by
Nelson Michael C and Nelson Margie
Purchase Details
Closed on
Aug 22, 1995
Sold by
Reed J R
Bought by
Reed J R
Purchase Details
Closed on
Jun 15, 1989
Bought by
Reed J R Monica J
Purchase Details
Closed on
May 18, 1989
Bought by
Dell Veneri Frederick A
Create a Home Valuation Report for This Property
The Home Valuation Report is an in-depth analysis detailing your home's value as well as a comparison with similar homes in the area
Home Values in the Area
Average Home Value in this Area
Purchase History
| Date | Buyer | Sale Price | Title Company |
|---|---|---|---|
| Ryan Slagle Lynn | $71,900 | -- | |
| Kim Mills | $50,000 | -- | |
| Thda | $67,986 | -- | |
| Tn Housing Dev Agency Suite 1114 | $68,000 | -- | |
| Nelson Michael C | $63,000 | -- | |
| Reed J R | $52,000 | -- | |
| Reed J R Monica J | -- | -- | |
| Dell Veneri Frederick A | -- | -- |
Source: Public Records
Mortgage History
| Date | Status | Borrower | Loan Amount |
|---|---|---|---|
| Open | Dell Veneri Frederick A | $71,900 |
Source: Public Records
Tax History Compared to Growth
Tax History
| Year | Tax Paid | Tax Assessment Tax Assessment Total Assessment is a certain percentage of the fair market value that is determined by local assessors to be the total taxable value of land and additions on the property. | Land | Improvement |
|---|---|---|---|---|
| 2024 | $660 | $24,825 | $2,975 | $21,850 |
| 2023 | $660 | $24,825 | $2,975 | $21,850 |
| 2022 | $614 | $24,825 | $2,975 | $21,850 |
| 2021 | $614 | $24,825 | $2,975 | $21,850 |
| 2020 | $483 | $24,825 | $2,975 | $21,850 |
| 2019 | $483 | $16,500 | $2,425 | $14,075 |
| 2018 | $450 | $16,500 | $2,425 | $14,075 |
| 2017 | $450 | $16,500 | $2,425 | $14,075 |
| 2016 | $450 | $16,500 | $2,425 | $14,075 |
| 2015 | $463 | $16,500 | $2,425 | $14,075 |
| 2014 | $462 | $16,487 | $0 | $0 |
Source: Public Records
Map
Nearby Homes
- 4724 Village Rd
- 4712 Village Rd
- 4708 Village Rd
- 4732 Village Rd
- 4624 Village Rd
- 100 Ridgewood Rd
- 4781 Village Rd
- 4618 Village Rd
- 112 Ridgewood Rd
- 4612 Village Rd
- 136 Ridgewood Rd
- 226 Ridgewood Rd
- 316 Ridgewood Rd
- 4820 Village Rd
- 214 Ridgewood Rd
- 4606 Village Rd
- 4827 Village Rd
- 4835 Village Rd
- 4510 Village Rd