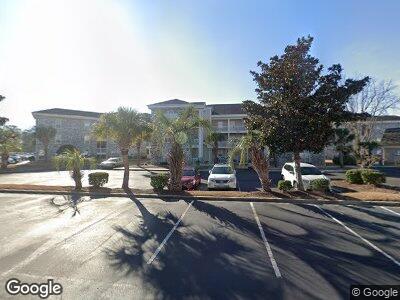
4717 Wild Iris Dr Unit 205 Myrtle Beach, SC 29577
Myrtlewood NeighborhoodEstimated Value: $153,000 - $162,000
1
Bed
2
Baths
800
Sq Ft
$196/Sq Ft
Est. Value
About This Home
This home is located at 4717 Wild Iris Dr Unit 205, Myrtle Beach, SC 29577 and is currently estimated at $156,661, approximately $195 per square foot. 4717 Wild Iris Dr Unit 205 is a home located in Horry County with nearby schools including Myrtle Beach Child Development Center, Myrtle Beach Elementary School, and Myrtle Beach Primary School.
Ownership History
Date
Name
Owned For
Owner Type
Purchase Details
Closed on
Apr 3, 2023
Sold by
Cohen Shanee K
Bought by
Cohen Meir and Cohen Dalia
Current Estimated Value
Purchase Details
Closed on
Feb 28, 2005
Sold by
Chan Leon
Bought by
Cohen Shanee K and Cohen Meir
Home Financials for this Owner
Home Financials are based on the most recent Mortgage that was taken out on this home.
Original Mortgage
$63,000
Interest Rate
5.6%
Mortgage Type
New Conventional
Purchase Details
Closed on
Jun 25, 2004
Sold by
Shirley Judy T and Shirley Jimmy O
Bought by
Chan Leon
Home Financials for this Owner
Home Financials are based on the most recent Mortgage that was taken out on this home.
Original Mortgage
$8,200
Interest Rate
5.97%
Mortgage Type
Credit Line Revolving
Purchase Details
Closed on
Jul 26, 2002
Sold by
Markel Walter E and Markel Carolyn B
Bought by
Shirley Judy T and Shirley Jimmy O
Create a Home Valuation Report for This Property
The Home Valuation Report is an in-depth analysis detailing your home's value as well as a comparison with similar homes in the area
Home Values in the Area
Average Home Value in this Area
Purchase History
| Date | Buyer | Sale Price | Title Company |
|---|---|---|---|
| Cohen Meir | -- | -- | |
| Cohen Shanee K | $70,000 | -- | |
| Chan Leon | $66,900 | -- | |
| Shirley Judy T | $65,900 | -- |
Source: Public Records
Mortgage History
| Date | Status | Borrower | Loan Amount |
|---|---|---|---|
| Previous Owner | Cohen Shanee K | $63,000 | |
| Previous Owner | Chan Leon | $8,200 | |
| Previous Owner | Chan Leon | $53,520 |
Source: Public Records
Tax History Compared to Growth
Tax History
| Year | Tax Paid | Tax Assessment Tax Assessment Total Assessment is a certain percentage of the fair market value that is determined by local assessors to be the total taxable value of land and additions on the property. | Land | Improvement |
|---|---|---|---|---|
| 2024 | $2,734 | $8,610 | $0 | $8,610 |
| 2023 | $2,734 | $8,610 | $0 | $8,610 |
| 2021 | $1,119 | $8,610 | $0 | $8,610 |
| 2020 | $1,067 | $8,610 | $0 | $8,610 |
| 2019 | $1,067 | $8,610 | $0 | $8,610 |
| 2018 | $0 | $6,300 | $0 | $6,300 |
| 2017 | $947 | $6,300 | $0 | $6,300 |
| 2016 | -- | $6,300 | $0 | $6,300 |
| 2015 | $936 | $2,400 | $0 | $2,400 |
| 2014 | -- | $2,400 | $0 | $2,400 |
Source: Public Records
Map
Nearby Homes
- 4703 Wild Iris Dr Unit 301
- 4717 Wild Iris Dr Unit 29-303
- 4705 Wild Iris Dr Unit 305
- 4701 Wild Iris Dr Unit 16-204
- 4683 Wild Iris Dr Unit 104
- 4683 Wild Iris Dr Unit 204
- 4709 Wild Iris Dr Unit 101
- 4709 Wild Iris Dr Unit 305
- 4709 Wild Iris Dr Unit 104
- 4725 Wild Iris Dr Unit 202
- 4773 Wild Iris Dr Unit 301
- 4773 Wild Iris Dr Unit 5-202
- 4729 Wild Iris Dr Unit 104 Magnolia Place
- 4737 Wild Iris Dr Unit 203
- 4733 Wild Iris Dr Unit 302
- 4741 Wild Iris Dr Unit 303 Magnolia Place
- 4753 Wild Iris Dr Unit 104
- 4757 Wild Iris Dr Unit 32-304
- 4749 Wild Iris Dr Unit 205
- 4679 Wild Iris Dr Unit 103
- 4717 Wild Iris Dr Unit 302
- 4717 Wild Iris Dr Unit 101
- 4717 Wild Iris Dr Unit Magnolia Place
- 4717 Wild Iris Dr Unit Bldg 29 Unit 102
- 4717 Wild Iris Dr Unit 29-203 MAGNOLIA PLAC
- 4717 Wild Iris Dr Unit Magnolia Place Unit
- 4717 Wild Iris Dr
- 4717 Wild Iris Dr Unit 29305
- 4717 Wild Iris Dr Unit 205
- 4717 Wild Iris Dr Unit 105
- 4717 Wild Iris Dr Unit 102
- 4717 Wild Iris Dr Unit 29101
- 4717 Wild Iris Dr Unit 29-103
- 4717 Wild Iris Dr Unit 29-201
- 4717 Wild Iris Dr Unit 29-301
- 4717 Wild Iris Dr Unit 103
- 4717 Wild Iris Dr Unit 29-105
- 4717 Wild Iris Dr Unit 305
- 4717 Wild Iris Dr Unit 303
- 4717 Wild Iris Dr Unit 104