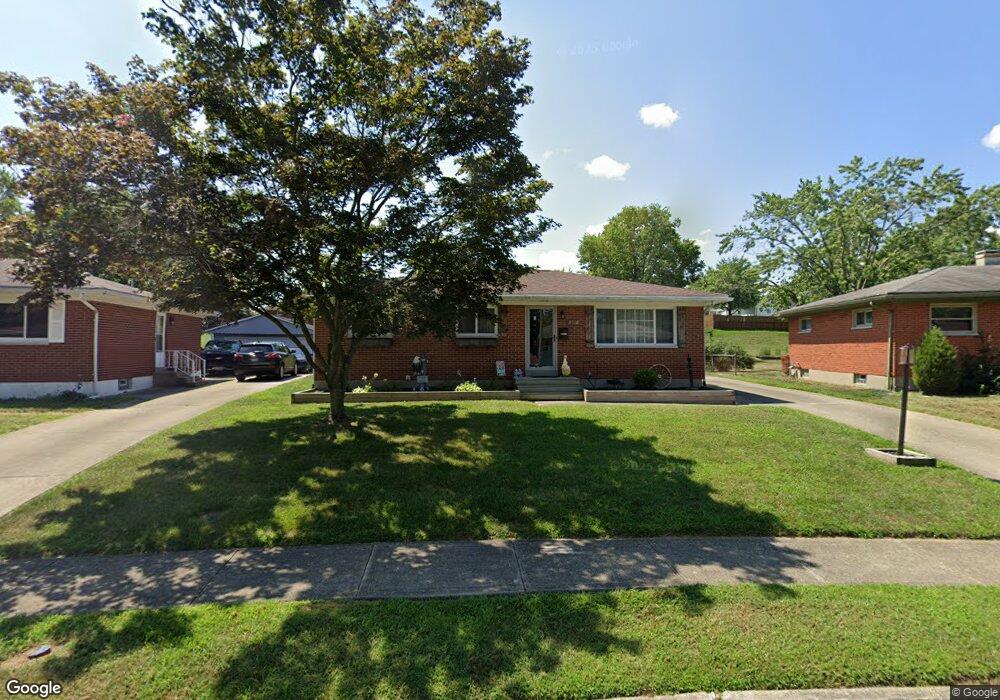
4718 Amesborough Rd Dayton, OH 45420
Belmont NeighborhoodEstimated Value: $190,000 - $210,785
3
Beds
2
Baths
1,548
Sq Ft
$129/Sq Ft
Est. Value
About This Home
This home is located at 4718 Amesborough Rd, Dayton, OH 45420 and is currently estimated at $199,446, approximately $128 per square foot. 4718 Amesborough Rd is a home located in Montgomery County with nearby schools including Eastmont Elementary, Horace Mann Elementary School, and Cleveland Elementary School.
Ownership History
Date
Name
Owned For
Owner Type
Purchase Details
Closed on
Mar 14, 2017
Sold by
Hoskins Myral
Bought by
Magill Michael C and Magill Patricia L
Current Estimated Value
Home Financials for this Owner
Home Financials are based on the most recent Mortgage that was taken out on this home.
Original Mortgage
$93,279
Outstanding Balance
$80,040
Interest Rate
5.5%
Mortgage Type
FHA
Estimated Equity
$119,406
Purchase Details
Closed on
Sep 21, 2016
Sold by
Hoskins Mona L and Burton Mona L
Bought by
Hoskins Myral
Purchase Details
Closed on
Jun 20, 2016
Sold by
Estate Of Maudie L Baner
Bought by
Mcmillan Edgar L
Purchase Details
Closed on
Apr 16, 2015
Sold by
Mcmillan John B
Bought by
Hoskins Myral and Hoskins Mona L
Purchase Details
Closed on
Apr 6, 2015
Sold by
Manson Maudie L
Bought by
Mcmillan John B
Create a Home Valuation Report for This Property
The Home Valuation Report is an in-depth analysis detailing your home's value as well as a comparison with similar homes in the area
Home Values in the Area
Average Home Value in this Area
Purchase History
| Date | Buyer | Sale Price | Title Company |
|---|---|---|---|
| Magill Michael C | $95,000 | Services Title Llc | |
| Hoskins Myral | -- | M&M Title Co | |
| Hoskins Myral | $35,000 | Multiple | |
| Mcmillan Edgar L | -- | None Available | |
| Hoskins Myral | $45,000 | None Available | |
| Mcmillan John B | $89,700 | Attorney |
Source: Public Records
Mortgage History
| Date | Status | Borrower | Loan Amount |
|---|---|---|---|
| Open | Magill Michael C | $93,279 |
Source: Public Records
Tax History Compared to Growth
Tax History
| Year | Tax Paid | Tax Assessment Tax Assessment Total Assessment is a certain percentage of the fair market value that is determined by local assessors to be the total taxable value of land and additions on the property. | Land | Improvement |
|---|---|---|---|---|
| 2024 | $2,843 | $50,820 | $11,770 | $39,050 |
| 2023 | $2,843 | $50,820 | $11,770 | $39,050 |
| 2022 | $2,538 | $35,050 | $8,120 | $26,930 |
| 2021 | $2,524 | $35,050 | $8,120 | $26,930 |
| 2020 | $2,519 | $35,050 | $8,120 | $26,930 |
| 2019 | $2,572 | $32,190 | $8,120 | $24,070 |
| 2018 | $2,576 | $32,190 | $8,120 | $24,070 |
| 2017 | $2,555 | $32,190 | $8,120 | $24,070 |
| 2016 | $2,690 | $31,370 | $8,120 | $23,250 |
| 2015 | $2,850 | $31,370 | $8,120 | $23,250 |
| 2014 | $2,850 | $31,370 | $8,120 | $23,250 |
| 2012 | -- | $34,430 | $7,820 | $26,610 |
Source: Public Records
Map
Nearby Homes
- 4802 Amesborough Rd
- 4643 Amesborough Rd
- 1508 Horlacher Ave
- 1512 Horlacher Ave
- 1513 Horlacher Ave
- 4549 Amesborough Rd
- 4527 Amesborough Rd
- 4515 Kingview Ave
- 2277 Lido Place
- 4869 Andes Dr
- 1744 Woodman Dr
- 2830 Kennedy Ave
- 1630 Falke Dr
- 1108 Chelsea Ave
- 4733 Barnhart Ave
- 1300 Watervliet Ave
- 1025 Weng Ave
- 4438 Woodbine Ave
- 1012 Chelsea Ave
- 4513 Woodbine Ave
- 4724 Amesborough Rd
- 4712 Amesborough Rd
- 4704 Amesborough Rd
- 4721 Amesborough Rd
- 4703 Amesborough Rd
- 4711 Amesborough Rd
- 4803 Amesborough Rd
- 4715 Eastgate Ave
- 4654 Amesborough Rd
- 4709 Eastgate Ave
- 4721 Eastgate Ave
- 4808 Amesborough Rd
- 4703 Eastgate Ave
- 4727 Eastgate Ave
- 4809 Amesborough Rd
- 4659 Amesborough Rd
- 4647 Eastgate Ave
- 4803 Eastgate Ave
- 4814 Amesborough Rd
- 4651 Amesborough Rd