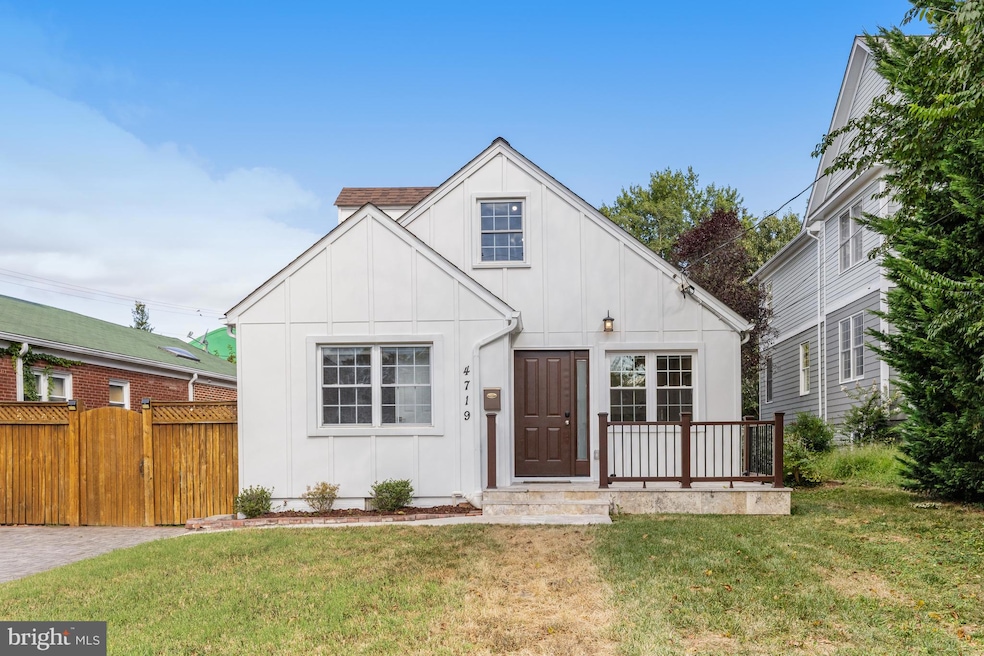
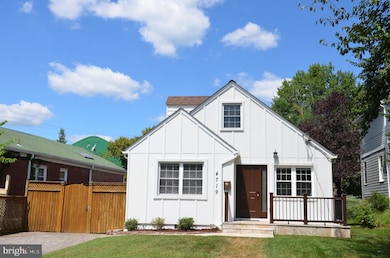
4719 25th St N Arlington, VA 22207
Old Dominion NeighborhoodEstimated payment $5,471/month
Highlights
- Open Floorplan
- Cape Cod Architecture
- Combination Kitchen and Living
- Discovery Elementary School Rated A
- Hydromassage or Jetted Bathtub
- No HOA
About This Home
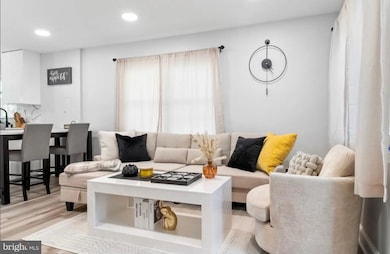
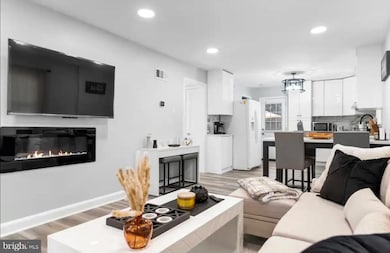
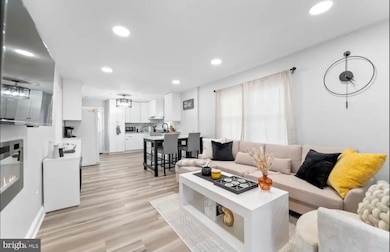
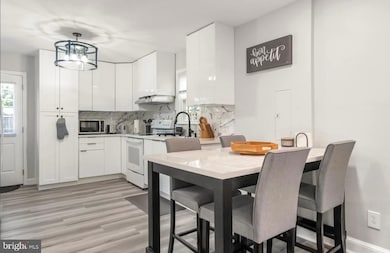
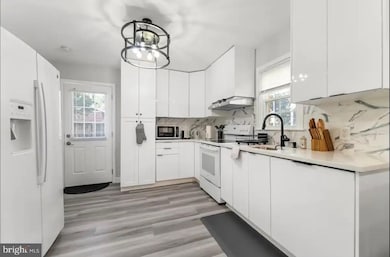
This beautifully renovated Cape Cod home offers a perfect blend of modern comfort and classic appeal. Brand new addition of a primary bath on the top floor. This delightful residence features 3 bedrooms and 3 full bathrooms, making it an ideal retreat for those seeking both space and style. The heart of the home boasts upgraded countertops and recessed lighting, enhancing the warm ambiance. A jetted tub in the bathroom invites relaxation, while the electric fireplace adds a touch of warmth and charm during cooler evenings. The kitchen is equipped with modern appliances, including an electric oven/range, refrigerator, dishwasher, and a convenient front-loading washer and dryer. The tankless water heater ensures endless hot water, making daily routines a breeze. Double-pane windows provide energy efficiency and a peaceful atmosphere, allowing you to enjoy the tranquility of your surroundings. Outside, the property features a lovely patio area, perfect for morning coffee or evening gatherings under the stars. The brick driveway offers ample parking for you and your guests, while a shed provides additional storage for your outdoor essentials. The Lyonhurst community is known for its friendly atmosphere and convenient access to local amenities. Residents enjoy nearby parks, shops, perfect for leisurely strolls or picnics. The neighborhood is also well-served by public services, ensuring a comfortable and connected lifestyle. With major renovations completed in 2023, this home is in excellent condition, ready for you to move in and make it your own, where every detail has been thoughtfully considered to create a true sense of home. If you have been looking for your first home or downsizing, then is charming home awaits your residence. See update list in Documents.
Open House Schedule
-
Sunday, December 07, 20252:00 to 4:00 pm12/7/2025 2:00:00 PM +00:0012/7/2025 4:00:00 PM +00:00Beautiful 3 bedroom 3 bath home in prime location.Add to Calendar
Home Details
Home Type
- Single Family
Est. Annual Taxes
- $8,847
Year Built
- Built in 1950 | Remodeled in 2023
Lot Details
- 4,550 Sq Ft Lot
- Privacy Fence
- Wood Fence
- Back Yard Fenced
- Property is in excellent condition
- Property is zoned R-6
Home Design
- Cape Cod Architecture
- Brick Exterior Construction
- Concrete Perimeter Foundation
Interior Spaces
- 1,127 Sq Ft Home
- Property has 2 Levels
- Open Floorplan
- Recessed Lighting
- Electric Fireplace
- Double Pane Windows
- Combination Kitchen and Living
- Luxury Vinyl Plank Tile Flooring
- Crawl Space
Kitchen
- Breakfast Area or Nook
- Electric Oven or Range
- Ice Maker
- Dishwasher
- Upgraded Countertops
- Disposal
Bedrooms and Bathrooms
- Hydromassage or Jetted Bathtub
Laundry
- Laundry on main level
- Front Loading Dryer
- Front Loading Washer
Parking
- 4 Parking Spaces
- 4 Driveway Spaces
- Brick Driveway
Outdoor Features
- Patio
- Shed
- Rain Gutters
Schools
- Williamsburg Middle School
- Yorktown High School
Utilities
- Forced Air Zoned Cooling and Heating System
- Cooling System Mounted In Outer Wall Opening
- Window Unit Cooling System
- Vented Exhaust Fan
- Tankless Water Heater
Community Details
- No Home Owners Association
- Lyonhurst Subdivision
Listing and Financial Details
- Assessor Parcel Number 03-063-026
Map
Home Values in the Area
Average Home Value in this Area
Tax History
| Year | Tax Paid | Tax Assessment Tax Assessment Total Assessment is a certain percentage of the fair market value that is determined by local assessors to be the total taxable value of land and additions on the property. | Land | Improvement |
|---|---|---|---|---|
| 2025 | $9,164 | $887,100 | $827,600 | $59,500 |
| 2024 | $8,847 | $856,400 | $797,600 | $58,800 |
| 2023 | $8,703 | $845,000 | $777,600 | $67,400 |
| 2022 | $8,370 | $812,600 | $732,600 | $80,000 |
| 2021 | $7,748 | $752,200 | $673,000 | $79,200 |
| 2020 | $7,307 | $712,200 | $633,000 | $79,200 |
| 2019 | $6,994 | $681,700 | $608,500 | $73,200 |
| 2018 | $6,509 | $665,700 | $583,500 | $82,200 |
| 2017 | $6,371 | $633,300 | $548,500 | $84,800 |
| 2016 | $6,322 | $637,900 | $552,000 | $85,900 |
| 2015 | $6,114 | $613,900 | $528,000 | $85,900 |
| 2014 | $5,589 | $561,100 | $475,200 | $85,900 |
Property History
| Date | Event | Price | List to Sale | Price per Sq Ft | Prior Sale |
|---|---|---|---|---|---|
| 12/02/2025 12/02/25 | For Sale | $899,000 | 0.0% | $798 / Sq Ft | |
| 08/25/2023 08/25/23 | Rented | $3,800 | 0.0% | -- | |
| 08/14/2023 08/14/23 | For Rent | $3,800 | 0.0% | -- | |
| 06/30/2023 06/30/23 | Sold | $780,000 | 0.0% | $692 / Sq Ft | View Prior Sale |
| 05/31/2023 05/31/23 | Pending | -- | -- | -- | |
| 05/25/2023 05/25/23 | For Sale | $779,900 | -- | $692 / Sq Ft |
Purchase History
| Date | Type | Sale Price | Title Company |
|---|---|---|---|
| Deed | -- | -- |
Source: Bright MLS
MLS Number: VAAR2066512
APN: 03-063-026
Disclaimer: Certain information contained herein is derived from information provided by parties other than Homes.com. All information provided is deemed reliable, but is not guaranteed to be accurate and should be independently verified.
![]() The data relating to real estate for sale on this website appears in part through the BRIGHT Internet Data Exchange program, a voluntary cooperative exchange of property listing data between licensed real estate brokerage firms, and is provided by BRIGHT through a licensing agreement.
The data relating to real estate for sale on this website appears in part through the BRIGHT Internet Data Exchange program, a voluntary cooperative exchange of property listing data between licensed real estate brokerage firms, and is provided by BRIGHT through a licensing agreement.
Listing information is from various brokers who participate in the Bright MLS IDX program and not all listings may be visible on the site.
The property information being provided on or through the website is for the personal, non-commercial use of consumers and such information may not be used for any purpose other than to identify prospective properties consumers may be interested in purchasing.
Some properties which appear for sale on the website may no longer be available because they are for instance, under contract, sold or are no longer being offered for sale.
Property information displayed is deemed reliable but is not guaranteed.
Copyright 2025 Bright MLS, Inc.
- 2532 N Glebe Rd
- 4771 26th St N
- 4777 26th St N
- 2323 N Burlington St
- 2520 N Vernon St
- 2329 N Edison St
- 4801 29th St N
- 5021 25th Rd N
- 4637 20th Rd N
- 5100 23rd Rd N
- 2460 N Utah St
- 4401 Cherry Hill Rd Unit 67
- 3100 N Glebe Rd
- 2724 N Dinwiddie St
- 4390 Lorcom Ln Unit 402
- 2030 N Vermont St Unit 304
- 0 N Emerson St
- 4752 33rd St N
- 2025 N Emerson St
- 4741 20th St N
- 4801 26th St N
- 2105 N Glebe Rd Unit FL1-ID8546A
- 2105 N Glebe Rd Unit FL1-ID5846A
- 2105 N Glebe Rd Unit FL2-ID8492A
- 2105 N Glebe Rd Unit FL2-ID6656A
- 2105 N Glebe Rd Unit FL2-ID7985A
- 2105 N Glebe Rd Unit FL1-ID5937A
- 2105 N Glebe Rd Unit FL2-ID8490A
- 2105 N Glebe Rd Unit FL4-ID5948A
- 2105 N Glebe Rd Unit FL4-ID7970A
- 2105 N Glebe Rd Unit FL4-ID7960A
- 2105 N Glebe Rd
- 2022 N Culpeper St
- 4400 Cherry Hill Rd
- 2025 N Glebe Rd
- 4725 Rock Spring Rd
- 5055 26th Rd N
- 4390 Lorcom Ln Unit 210
- 4390 Lorcom Ln Unit 503
- 4706 32nd St N
