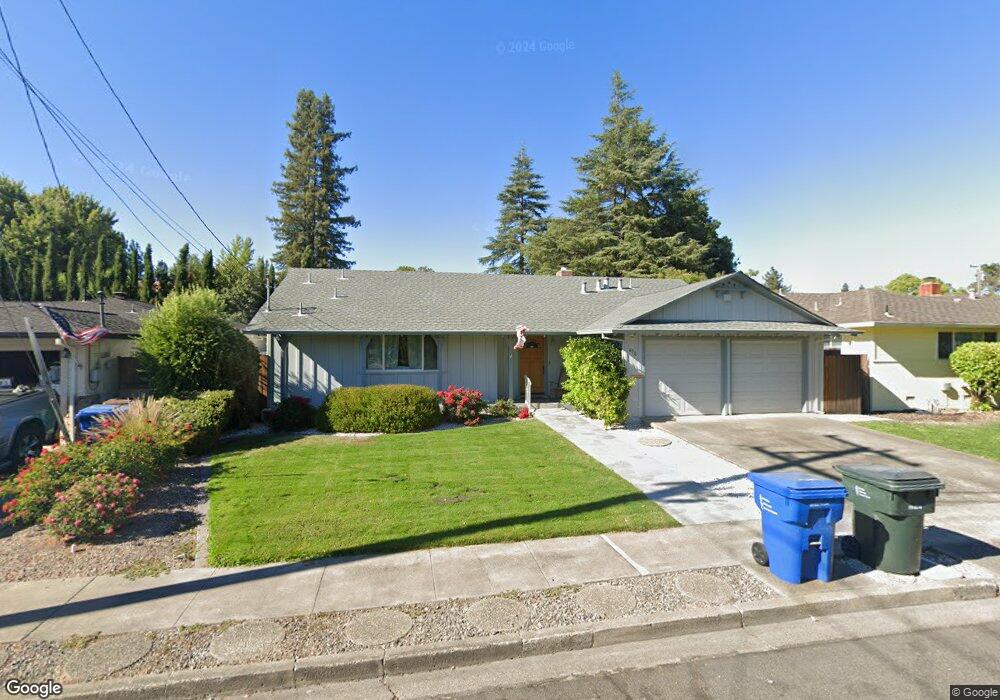
472 Chase St Sonoma, CA 95476
Estimated Value: $988,898 - $1,378,000
3
Beds
2
Baths
1,550
Sq Ft
$762/Sq Ft
Est. Value
About This Home
This home is located at 472 Chase St, Sonoma, CA 95476 and is currently estimated at $1,180,475, approximately $761 per square foot. 472 Chase St is a home located in Sonoma County with nearby schools including Prestwood Elementary School, Adele Harrison Middle School, and Creekside High School.
Ownership History
Date
Name
Owned For
Owner Type
Purchase Details
Closed on
Mar 25, 2025
Sold by
Scott Calvin Bauder And Michel Denice Co and Cordellos Cherie L
Bought by
Cordellos Sisters Llc
Current Estimated Value
Purchase Details
Closed on
Dec 12, 2018
Sold by
Cordellos Michel and Edythe Cordellos Revocable Tru
Bought by
Bauder Scott Calvin and Cordellos Michel Denice
Purchase Details
Closed on
May 7, 2014
Sold by
Cordellos Tom Dennis and Cordellos Edythe B
Bought by
Cordellos Tom Dennis and Edythe Cordellos Revocable Tru
Purchase Details
Closed on
Oct 2, 1997
Sold by
Bancroft Roger E and Bancroft Jean
Bought by
Cordellos Lambro and Cordellos Edythe
Purchase Details
Closed on
Aug 12, 1997
Sold by
Mcdaniel Neil W and The Neil W & Amelia G Mcdaniel
Bought by
Cordellos Lambro and Cordellos Edythe
Create a Home Valuation Report for This Property
The Home Valuation Report is an in-depth analysis detailing your home's value as well as a comparison with similar homes in the area
Home Values in the Area
Average Home Value in this Area
Purchase History
| Date | Buyer | Sale Price | Title Company |
|---|---|---|---|
| Cordellos Sisters Llc | -- | None Listed On Document | |
| Bauder Scott Calvin | -- | None Available | |
| Cordellos Tom Dennis | -- | None Available | |
| Cordellos Lambro | $260,000 | Sonoma Title Guaranty Compan | |
| Cordellos Lambro | $400,000 | Sonoma Title Guaranty |
Source: Public Records
Tax History
| Year | Tax Paid | Tax Assessment Tax Assessment Total Assessment is a certain percentage of the fair market value that is determined by local assessors to be the total taxable value of land and additions on the property. | Land | Improvement |
|---|---|---|---|---|
| 2025 | $2,666 | $89,889 | $27,041 | $62,848 |
| 2024 | $2,666 | $88,127 | $26,511 | $61,616 |
| 2023 | $2,666 | $86,400 | $25,992 | $60,408 |
| 2022 | $2,484 | $84,707 | $25,483 | $59,224 |
| 2021 | $2,242 | $83,047 | $24,984 | $58,063 |
| 2020 | $2,207 | $82,196 | $24,728 | $57,468 |
| 2019 | $2,154 | $80,586 | $24,244 | $56,342 |
| 2018 | $2,105 | $79,007 | $23,769 | $55,238 |
| 2017 | $1,915 | $77,458 | $23,303 | $54,155 |
| 2016 | $1,709 | $75,941 | $22,847 | $53,094 |
| 2015 | $1,717 | $74,801 | $22,504 | $52,297 |
| 2014 | $2,292 | $73,337 | $22,064 | $51,273 |
Source: Public Records
Map
Nearby Homes
Your Personal Tour Guide
Ask me questions while you tour the home.