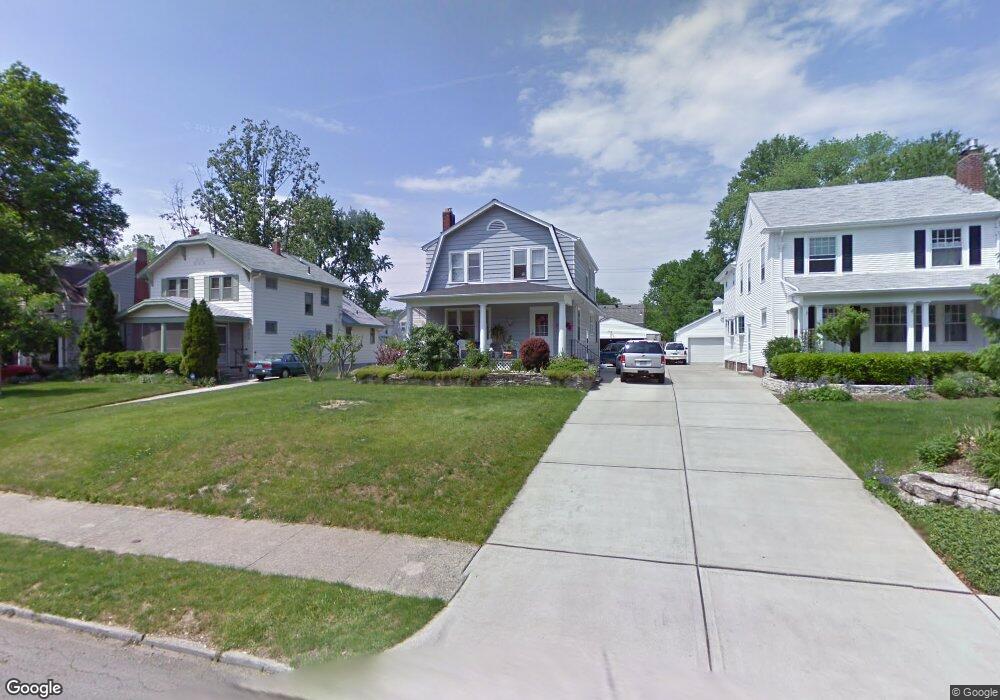
472 E Torrence Rd Columbus, OH 43214
Clintonville NeighborhoodEstimated Value: $512,000 - $596,000
3
Beds
3
Baths
1,951
Sq Ft
$287/Sq Ft
Est. Value
About This Home
This home is located at 472 E Torrence Rd, Columbus, OH 43214 and is currently estimated at $560,520, approximately $287 per square foot. 472 E Torrence Rd is a home located in Franklin County with nearby schools including Clinton Elementary School, Dominion Middle School, and Whetstone High School.
Ownership History
Date
Name
Owned For
Owner Type
Purchase Details
Closed on
May 15, 2017
Sold by
Tolliver Enhima Lee and Tolliver William T
Bought by
Tolliver Emma Lee and Tolliver William T
Current Estimated Value
Purchase Details
Closed on
Jan 5, 2017
Sold by
Tolliver William T and Tolliver Emma Lee
Bought by
Tolliver William T and Tolliver Emma Lee
Purchase Details
Closed on
Oct 18, 2002
Sold by
Tolliver Emma L
Bought by
Tolliver Emma Lee and The Emma Lee Tolliver Family T
Purchase Details
Closed on
Jun 25, 1997
Sold by
Tolliver William T and Tolliver Emma L
Bought by
Tolliver Emma Lee
Create a Home Valuation Report for This Property
The Home Valuation Report is an in-depth analysis detailing your home's value as well as a comparison with similar homes in the area
Home Values in the Area
Average Home Value in this Area
Purchase History
| Date | Buyer | Sale Price | Title Company |
|---|---|---|---|
| Tolliver Emma Lee | -- | None Available | |
| Tolliver Emma Lee | -- | None Available | |
| Tolliver William T | -- | None Available | |
| Tolliver Emma Lee | -- | Lawyers Title | |
| Tolliver Emma Lee | -- | -- |
Source: Public Records
Tax History
| Year | Tax Paid | Tax Assessment Tax Assessment Total Assessment is a certain percentage of the fair market value that is determined by local assessors to be the total taxable value of land and additions on the property. | Land | Improvement |
|---|---|---|---|---|
| 2025 | $6,433 | $153,130 | $57,610 | $95,520 |
| 2024 | $6,433 | $153,130 | $57,610 | $95,520 |
| 2023 | $6,378 | $153,125 | $57,610 | $95,515 |
| 2022 | $7,296 | $149,420 | $37,590 | $111,830 |
| 2021 | $7,309 | $149,420 | $37,590 | $111,830 |
| 2020 | $7,318 | $149,420 | $37,590 | $111,830 |
| 2019 | $6,483 | $115,610 | $28,910 | $86,700 |
| 2018 | $5,770 | $115,610 | $28,910 | $86,700 |
| 2017 | $6,032 | $115,610 | $28,910 | $86,700 |
| 2016 | $5,586 | $93,070 | $32,240 | $60,830 |
| 2015 | $5,070 | $93,070 | $32,240 | $60,830 |
| 2014 | $5,083 | $93,070 | $32,240 | $60,830 |
| 2013 | $2,375 | $88,620 | $30,695 | $57,925 |
Source: Public Records
Map
Nearby Homes
- 467 Brevoort Rd
- 531 Richards Rd
- 544 Piedmont Rd
- 374 Acton Rd
- 440 Chatham Rd
- 3546 Beulah Rd
- 107 E Dunedin Rd
- 589 Clinton Heights Ave
- 188 Chatham Rd
- 30 E Torrence Rd
- 37 Glencoe Rd
- 83 Clinton Heights Ave
- 796 E Kenworth Rd
- 296 Walhalla Rd
- 76 E Lakeview Ave
- 82 Blenheim Rd
- 390 Lenappe Dr
- 991 Hidden Acres Ct Unit 991
- 126 Erie Rd
- 84-86 W Como Ave
- 464 E Torrence Rd
- 478 E Torrence Rd
- 458 E Torrence Rd
- 484 E Torrence Rd
- 481 Arden Rd
- 452 E Torrence Rd
- 475 Arden Rd
- 487 Arden Rd
- 490 E Torrence Rd
- 493 Arden Rd
- 446 E Torrence Rd
- 469 E Torrence Rd
- 500 E Torrence Rd
- 461 Arden Rd
- 475 E Torrence Rd
- 461 E Torrence Rd
- 499 Arden Rd
- 481 E Torrence Rd
- 455 E Torrence Rd
- 507 Arden Rd
Your Personal Tour Guide
Ask me questions while you tour the home.