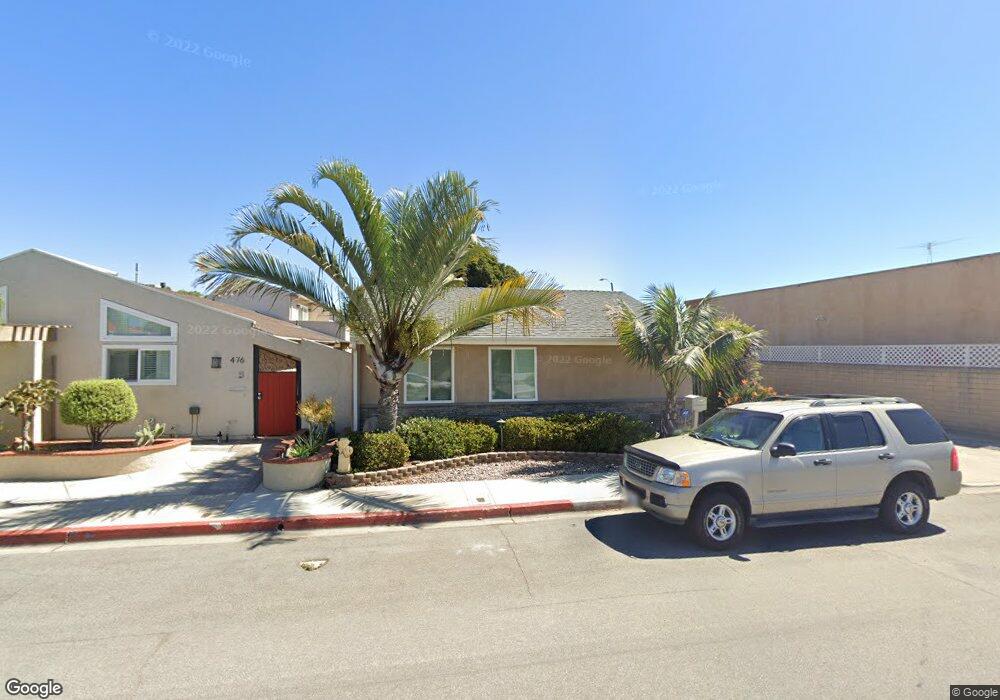
472 Galleon Way Seal Beach, CA 90740
Estimated Value: $1,522,186 - $1,646,000
2
Beds
2
Baths
1,431
Sq Ft
$1,127/Sq Ft
Est. Value
About This Home
This home is located at 472 Galleon Way, Seal Beach, CA 90740 and is currently estimated at $1,612,797, approximately $1,127 per square foot. 472 Galleon Way is a home located in Orange County with nearby schools including J. H. Mcgaugh Elementary School, Jack L. Weaver Elementary School, and Sharon Christa Mcauliffe Middle School.
Ownership History
Date
Name
Owned For
Owner Type
Purchase Details
Closed on
Dec 18, 2017
Sold by
Straub John E
Bought by
Straub John Edward
Current Estimated Value
Home Financials for this Owner
Home Financials are based on the most recent Mortgage that was taken out on this home.
Original Mortgage
$175,000
Outstanding Balance
$97,296
Interest Rate
3.9%
Mortgage Type
New Conventional
Estimated Equity
$1,515,501
Purchase Details
Closed on
Jun 19, 2014
Sold by
Straub John E
Bought by
Straub John E and The John E Straub Living Trust
Purchase Details
Closed on
Mar 13, 2006
Sold by
Rathjens Patricia J
Bought by
Straub John E
Purchase Details
Closed on
Feb 2, 2005
Sold by
Vazquez Irais G
Bought by
Vazquez Irais G and Azpeitia Ramon Larios
Create a Home Valuation Report for This Property
The Home Valuation Report is an in-depth analysis detailing your home's value as well as a comparison with similar homes in the area
Home Values in the Area
Average Home Value in this Area
Purchase History
| Date | Buyer | Sale Price | Title Company |
|---|---|---|---|
| Straub John Edward | -- | Ticor Title | |
| Straub John E | -- | None Available | |
| Straub John E | -- | None Available | |
| Vazquez Irais G | -- | -- |
Source: Public Records
Mortgage History
| Date | Status | Borrower | Loan Amount |
|---|---|---|---|
| Open | Straub John Edward | $175,000 |
Source: Public Records
Tax History Compared to Growth
Tax History
| Year | Tax Paid | Tax Assessment Tax Assessment Total Assessment is a certain percentage of the fair market value that is determined by local assessors to be the total taxable value of land and additions on the property. | Land | Improvement |
|---|---|---|---|---|
| 2025 | $9,549 | $1,016,850 | $895,798 | $121,052 |
| 2024 | $9,549 | $996,912 | $878,233 | $118,679 |
| 2023 | $9,400 | $977,365 | $861,013 | $116,352 |
| 2022 | $9,398 | $958,201 | $844,130 | $114,071 |
| 2021 | $9,189 | $939,413 | $827,578 | $111,835 |
| 2020 | $9,461 | $929,781 | $819,092 | $110,689 |
| 2019 | $9,182 | $911,550 | $803,031 | $108,519 |
| 2018 | $8,785 | $893,677 | $787,285 | $106,392 |
| 2017 | $7,856 | $806,094 | $771,158 | $34,936 |
| 2016 | $7,344 | $855,855 | $756,038 | $99,817 |
| 2015 | $9,684 | $843,000 | $744,682 | $98,318 |
| 2014 | $7,832 | $676,896 | $578,578 | $98,318 |
Source: Public Records
Map
Nearby Homes
- 476 Galleon Way
- 480 Galleon Way
- 484 Galleon Way
- 452 Pacific Coast Hwy
- 467 Galleon Way
- 463 Galleon Way
- 488 Galleon Way
- 471 Galleon Way
- 459 Galleon Way
- 475 Galleon Way
- 455 Galleon Way
- 492 Galleon Way
- 479 Galleon Way
- 451 Galleon Way
- 483 Galleon Way
- 434 Schooner Way
- 487 Galleon Way
- 310 Coastline Dr
- 320 Coastline Dr
- 300 Coastline Dr