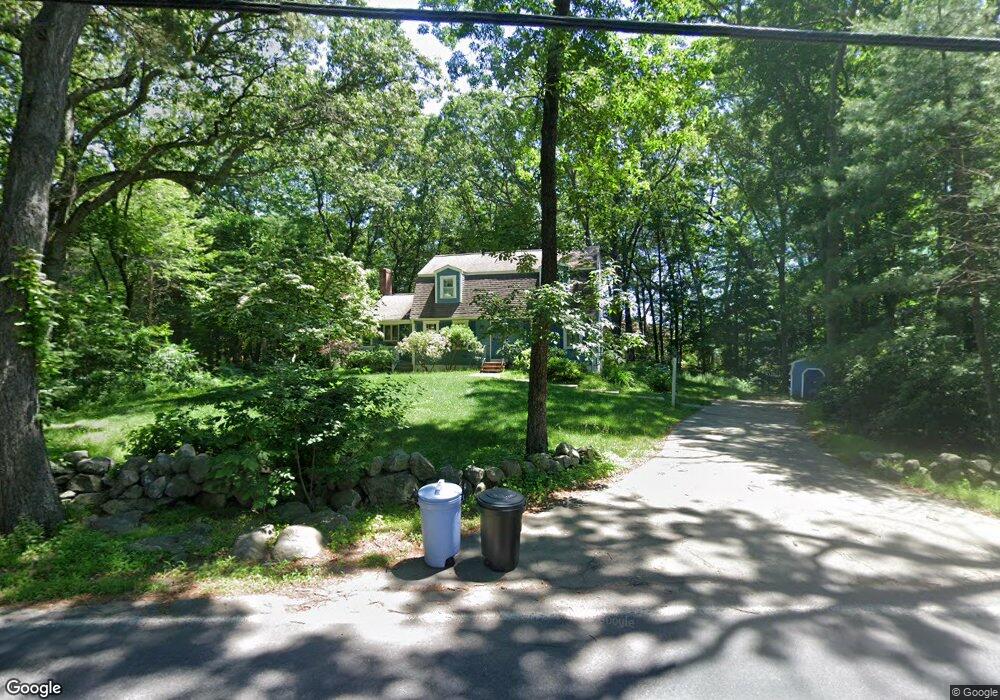
472 High St Walpole, MA 02081
Estimated Value: $832,284 - $943,000
3
Beds
2
Baths
2,104
Sq Ft
$433/Sq Ft
Est. Value
About This Home
This home is located at 472 High St, Walpole, MA 02081 and is currently estimated at $910,821, approximately $432 per square foot. 472 High St is a home located in Norfolk County with nearby schools including Elm Street School, Eleanor N. Johnson Middle School, and Walpole High School.
Ownership History
Date
Name
Owned For
Owner Type
Purchase Details
Closed on
Jul 18, 2008
Sold by
Devereau Doris R
Bought by
Herrmann Nancy M and Herrmann Virginia L
Current Estimated Value
Home Financials for this Owner
Home Financials are based on the most recent Mortgage that was taken out on this home.
Original Mortgage
$125,000
Outstanding Balance
$81,049
Interest Rate
6.17%
Mortgage Type
Purchase Money Mortgage
Estimated Equity
$829,772
Create a Home Valuation Report for This Property
The Home Valuation Report is an in-depth analysis detailing your home's value as well as a comparison with similar homes in the area
Home Values in the Area
Average Home Value in this Area
Purchase History
| Date | Buyer | Sale Price | Title Company |
|---|---|---|---|
| Herrmann Nancy M | $483,000 | -- |
Source: Public Records
Mortgage History
| Date | Status | Borrower | Loan Amount |
|---|---|---|---|
| Open | Herrmann Nancy M | $125,000 |
Source: Public Records
Tax History
| Year | Tax Paid | Tax Assessment Tax Assessment Total Assessment is a certain percentage of the fair market value that is determined by local assessors to be the total taxable value of land and additions on the property. | Land | Improvement |
|---|---|---|---|---|
| 2025 | $9,683 | $754,700 | $410,600 | $344,100 |
| 2024 | $9,409 | $711,700 | $395,000 | $316,700 |
| 2023 | $8,999 | $647,900 | $343,300 | $304,600 |
| 2022 | $8,469 | $585,700 | $317,900 | $267,800 |
| 2021 | $8,300 | $559,300 | $300,000 | $259,300 |
| 2020 | $8,111 | $541,100 | $282,800 | $258,300 |
| 2019 | $7,763 | $514,100 | $272,000 | $242,100 |
| 2018 | $7,409 | $485,200 | $261,700 | $223,500 |
| 2017 | $7,191 | $469,100 | $251,600 | $217,500 |
| 2016 | $7,028 | $451,700 | $244,300 | $207,400 |
| 2015 | $6,771 | $431,300 | $233,400 | $197,900 |
| 2014 | $6,572 | $417,000 | $233,400 | $183,600 |
Source: Public Records
Map
Nearby Homes
- 26 Dover Dr
- 19 and 23 Arlington Ln
- 111 Elm St
- 115 High St
- 8 Mckinley Ave
- 241 Fisher St
- 104 Wood End Ln
- 15 Homestead Dr
- 17 Fairview Rd
- 56 North St
- 291 Plimpton St
- 260 Elm St
- 40 Hearthstone Dr
- 881 Main St Unit 9
- 17 Rolling Ln
- 26 Albemarle Rd
- 38 Garden Pkwy
- 82 Pleasant St
- 80 Pleasant St
- 26 Maple Ln Unit 26
Your Personal Tour Guide
Ask me questions while you tour the home.