Estimated Value: $160,000 - $182,000
3
Beds
2
Baths
1,052
Sq Ft
$165/Sq Ft
Est. Value
About This Home
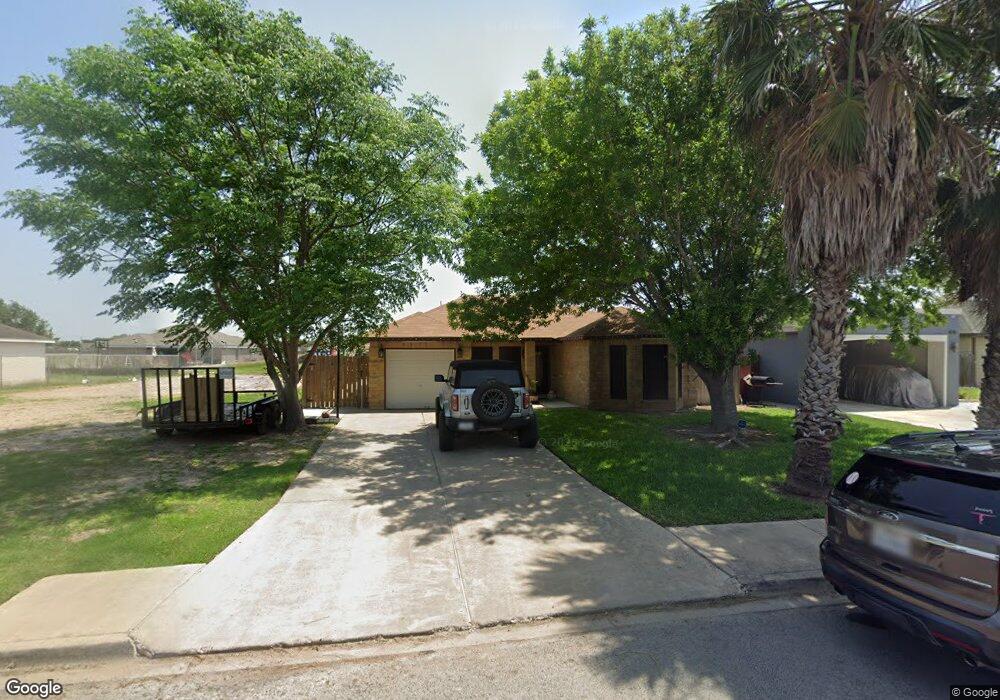
This home is located at 472 Serg Loop, Alamo, TX 78516 and is currently estimated at $173,446, approximately $164 per square foot. 472 Serg Loop is a home located in Hidalgo County with nearby schools including Capt. D. Salinas Elementary School, A.P. Solis Middle School, and Donna High School.
Ownership History
Date
Name
Owned For
Owner Type
Purchase Details
Closed on
Apr 25, 2014
Sold by
Tommie Valladares Virginia P and Uresti Andres Valladares
Bought by
Rodriguez Jorge R
Current Estimated Value
Home Financials for this Owner
Home Financials are based on the most recent Mortgage that was taken out on this home.
Original Mortgage
$66,276
Outstanding Balance
$51,149
Interest Rate
4.75%
Mortgage Type
FHA
Estimated Equity
$122,297
Purchase Details
Closed on
Jul 13, 2007
Sold by
Grande Valley Homes Llc
Bought by
Valladares Virginia P Tommie and Uresti Andres Valladares
Home Financials for this Owner
Home Financials are based on the most recent Mortgage that was taken out on this home.
Original Mortgage
$72,800
Interest Rate
6.64%
Mortgage Type
Seller Take Back
Create a Home Valuation Report for This Property
The Home Valuation Report is an in-depth analysis detailing your home's value as well as a comparison with similar homes in the area
Home Values in the Area
Average Home Value in this Area
Purchase History
| Date | Buyer | Sale Price | Title Company |
|---|---|---|---|
| Rodriguez Jorge R | -- | Edwards Abstract And Title C | |
| Valladares Virginia P Tommie | -- | None Available |
Source: Public Records
Mortgage History
| Date | Status | Borrower | Loan Amount |
|---|---|---|---|
| Open | Rodriguez Jorge R | $66,276 | |
| Previous Owner | Valladares Virginia P Tommie | $72,800 |
Source: Public Records
Tax History
| Year | Tax Paid | Tax Assessment Tax Assessment Total Assessment is a certain percentage of the fair market value that is determined by local assessors to be the total taxable value of land and additions on the property. | Land | Improvement |
|---|---|---|---|---|
| 2025 | $2,332 | $145,219 | -- | -- |
| 2024 | $2,332 | $132,017 | -- | -- |
| 2023 | $3,055 | $120,015 | $0 | $0 |
| 2022 | $2,785 | $106,895 | $0 | $0 |
| 2021 | $2,550 | $97,177 | $25,000 | $85,701 |
| 2020 | $2,395 | $88,343 | $22,813 | $78,759 |
| 2019 | $2,125 | $77,500 | $22,813 | $54,687 |
| 2018 | $2,128 | $78,127 | $22,813 | $55,314 |
| 2017 | $2,017 | $73,132 | $17,188 | $55,944 |
| 2016 | $2,035 | $73,760 | $17,188 | $56,572 |
| 2015 | $2,026 | $75,017 | $17,188 | $57,829 |
Source: Public Records
Map
Nearby Homes
Your Personal Tour Guide
Ask me questions while you tour the home.