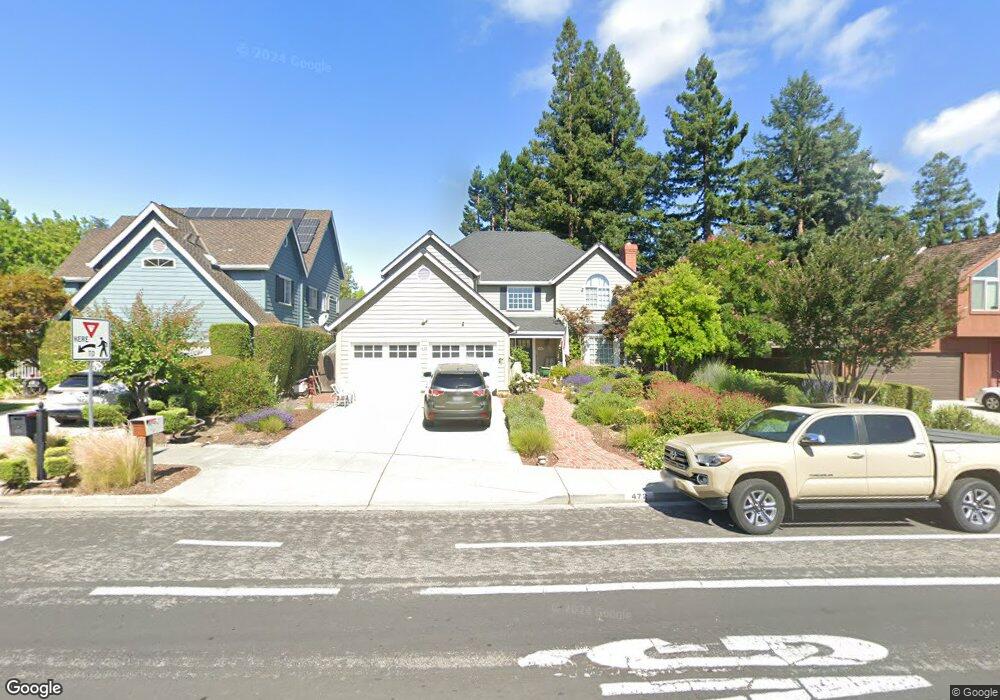
472 Sylvan Ave Mountain View, CA 94041
Estimated Value: $2,489,000 - $3,380,000
4
Beds
3
Baths
2,502
Sq Ft
$1,240/Sq Ft
Est. Value
About This Home
This home is located at 472 Sylvan Ave, Mountain View, CA 94041 and is currently estimated at $3,101,888, approximately $1,239 per square foot. 472 Sylvan Ave is a home located in Santa Clara County with nearby schools including Edith Landels Elementary School, Isaac Newton Graham Middle School, and Mountain View High School.
Ownership History
Date
Name
Owned For
Owner Type
Purchase Details
Closed on
Nov 23, 2009
Sold by
Martello Michael D and Martello Pamela J
Bought by
Howes Edward Thomas and Howes Cherilyn Jean
Current Estimated Value
Home Financials for this Owner
Home Financials are based on the most recent Mortgage that was taken out on this home.
Original Mortgage
$200,000
Outstanding Balance
$130,525
Interest Rate
4.99%
Mortgage Type
Purchase Money Mortgage
Estimated Equity
$2,971,363
Purchase Details
Closed on
Feb 11, 2009
Sold by
Martello Michael D
Bought by
Martello Michael D and Martello Pamela J
Purchase Details
Closed on
Jan 28, 2005
Sold by
Divens William G and Julie Bass Divens E
Bought by
Martello Michael D
Home Financials for this Owner
Home Financials are based on the most recent Mortgage that was taken out on this home.
Original Mortgage
$800,000
Interest Rate
5.12%
Mortgage Type
Purchase Money Mortgage
Create a Home Valuation Report for This Property
The Home Valuation Report is an in-depth analysis detailing your home's value as well as a comparison with similar homes in the area
Purchase History
We collect this data history from publicly available records. To have your information removed, we recommend requesting removal directly through your county’s website.
| Date | Buyer | Sale Price | Title Company |
|---|---|---|---|
| Howes Edward Thomas | $1,340,000 | First American Title Company | |
| Martello Michael D | -- | None Available | |
| Martello Michael D | $1,000,000 | First American Title Company |
Source: Public Records
Mortgage History
We collect this data history from publicly available records. To have your information removed, we recommend requesting removal directly through your county’s website.
| Date | Status | Borrower | Loan Amount |
|---|---|---|---|
| Open | Howes Edward Thomas | $200,000 | |
| Previous Owner | Martello Michael D | $800,000 | |
| Closed | Martello Michael D | $100,000 |
Source: Public Records
Tax History
| Year | Tax Paid | Tax Assessment Tax Assessment Total Assessment is a certain percentage of the fair market value that is determined by local assessors to be the total taxable value of land and additions on the property. | Land | Improvement |
|---|---|---|---|---|
| 2025 | $20,491 | $1,729,693 | $1,037,818 | $691,875 |
| 2024 | $19,872 | $1,695,778 | $1,017,469 | $678,309 |
| 2023 | $19,667 | $1,662,528 | $997,519 | $665,009 |
| 2022 | $19,613 | $1,629,930 | $977,960 | $651,970 |
| 2021 | $19,132 | $1,597,972 | $958,785 | $639,187 |
| 2020 | $19,157 | $1,581,587 | $948,954 | $632,633 |
| 2019 | $18,345 | $1,550,577 | $930,348 | $620,229 |
| 2018 | $18,142 | $1,520,174 | $912,106 | $608,068 |
| 2017 | $17,386 | $1,490,368 | $894,222 | $596,146 |
| 2016 | $16,917 | $1,461,146 | $876,689 | $584,457 |
| 2015 | $16,427 | $1,439,199 | $863,521 | $575,678 |
| 2014 | $16,275 | $1,411,008 | $846,606 | $564,402 |
Source: Public Records
Map
Nearby Homes
- 433 Sylvan Ave Unit 120
- 433 Sylvan Ave Unit 84
- 433 Sylvan Ave Unit 134
- 635 Tami Way
- 501 Moorpark Way Unit 65
- 501 Moorpark Way Unit 104
- 1248 Cortez Dr
- 492 Kahlo St
- 1241 Coronado Dr
- 451 Chagall St
- 365 Shelby Dr
- 377 S Bernardo Ave
- 154 Paseo Ct
- 189 Bedford Loop Unit 82
- 191 E El Camino Real Unit 138
- 191 E El Camino Real Unit 286
- 118 Minaret Ave
- 1031 Crestview Dr Unit 305
- 361 Pacific Dr
- 3702 Pyramid Way
- 468 Sylvan Ave
- 464 Sylvan Ave
- 409 Hedgerow Ct
- 799 Glenborough Dr
- 476 Sylvan Ave
- 460 Sylvan Ave
- 501 Sylvan Ave
- 413 Hedgerow Ct
- 407 Hedgerow Ct
- 795 Glenborough Dr
- 507 Sylvan Ave
- 452 Sylvan Ave
- 415 Hedgerow Ct
- 789 Glenborough Dr
- 405 Hedgerow Ct
- 804 E Dana St
- 420 Sylvan Ave
- 403 Hedgerow Ct
- 515 Sylvan Ave
- 808 E Dana St
Your Personal Tour Guide
Ask me questions while you tour the home.