
Seller's Agent in 2016
Vasanti Bhatt
Home 4 U Realty, Inc.
(847) 598-0727
1 in this area
77 Total Sales


Estimated Value: $365,000 - $429,000
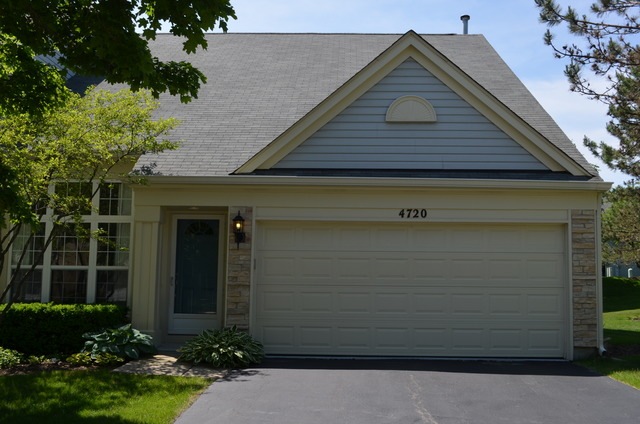
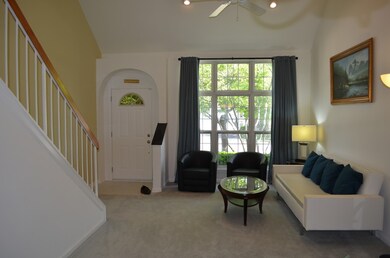
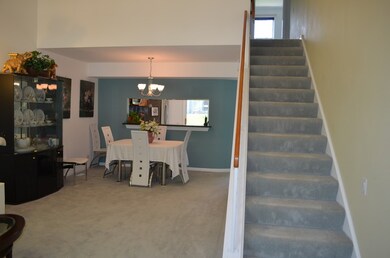
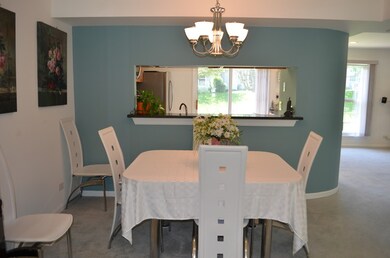
RARE FIND UPGRADED COVENTRY MODEL IN DESIREABLE HEARHSTONE SUBDIVISION, VOLUME/VAULTED CELINGS IN LIVING & DINING ROOMS.UPGRADED KITCHEN WITH GRANITE COUNTERTOPS ,SS APPLIANCES,SLIDERS 2 PATIO, & OVERSIZED FAM RM , 1ST FLR LAUNDRY. MASTER BEDROOM HAS LARGE WALK-IN CLOSET,UPGRADED LUXURY BATH . HUGE CLOSETS IN BRMS! QUIET LOCATION. WM FREMD HIGH SCHOOL
Last Agent to Sell the Property
Home 4 U Realty, Inc. License #471017113 Listed on: 06/06/2016
We collect this data history from publicly available records. To have your information removed, we recommend requesting removal directly through your county’s website.
| Date | Buyer | Sale Price | Title Company |
|---|---|---|---|
| Varanasi Shilpa | $248,000 | Chicago Title |
We collect this data history from publicly available records. To have your information removed, we recommend requesting removal directly through your county’s website.
| Date | Status | Borrower | Loan Amount |
|---|---|---|---|
| Open | Varanasi Shilpa | $198,400 |
| Date | Event | Price | List to Sale | Price per Sq Ft |
|---|---|---|---|---|
| 08/02/2016 08/02/16 | Sold | $248,000 | -2.7% | $146 / Sq Ft |
| 06/11/2016 06/11/16 | Pending | -- | -- | -- |
| 06/06/2016 06/06/16 | For Sale | $254,900 | -- | $150 / Sq Ft |
| Year | Tax Paid | Tax Assessment Tax Assessment Total Assessment is a certain percentage of the fair market value that is determined by local assessors to be the total taxable value of land and additions on the property. | Land | Improvement |
|---|---|---|---|---|
| 2025 | $7,567 | $36,000 | $7,683 | $28,317 |
| 2024 | $7,567 | $28,000 | $5,000 | $23,000 |
| 2023 | $7,283 | $28,000 | $5,000 | $23,000 |
| 2022 | $7,283 | $28,000 | $5,000 | $23,000 |
| 2021 | $6,547 | $22,883 | $3,001 | $19,882 |
| 2020 | $7,494 | $22,883 | $3,001 | $19,882 |
| 2019 | $7,415 | $25,370 | $3,001 | $22,369 |
| 2018 | $8,012 | $25,290 | $2,761 | $22,529 |
| 2017 | $7,863 | $25,290 | $2,761 | $22,529 |
| 2016 | $7,298 | $25,290 | $2,761 | $22,529 |
| 2015 | $5,051 | $20,749 | $2,521 | $18,228 |
| 2014 | $5,871 | $24,927 | $2,521 | $22,406 |
| 2013 | $5,859 | $24,927 | $2,521 | $22,406 |
Seller's Agent in 2016
Vasanti Bhatt
Home 4 U Realty, Inc.
(847) 598-0727
1 in this area
77 Total Sales
Buyer's Agent in 2016
Yoomi Kuk
Coldwell Banker Realty
(847) 809-4048
6 in this area
45 Total Sales
Source: Midwest Real Estate Data (MRED)
MLS Number: MRD09249190
APN: 02-19-148-004-0000
Disclaimer: Certain information contained herein is derived from information provided by parties other than Homes.com. All information provided is deemed reliable, but is not guaranteed to be accurate and should be independently verified.
![]() All data is obtained from various sources and may not have been verified by broker or MLS GRID. Supplied Open House Information is subject to change without notice. All information should be independently reviewed and verified for accuracy. Properties may or may not be listed by the office/agent presenting the information. Some IDX listings have been excluded from this website.
All data is obtained from various sources and may not have been verified by broker or MLS GRID. Supplied Open House Information is subject to change without notice. All information should be independently reviewed and verified for accuracy. Properties may or may not be listed by the office/agent presenting the information. Some IDX listings have been excluded from this website.
Listings courtesy of Midwest Real Estate Data (MRED) as distributed by MLS GRID.
Based on information submitted to the MLS GRID
Ask me questions while you tour the home.