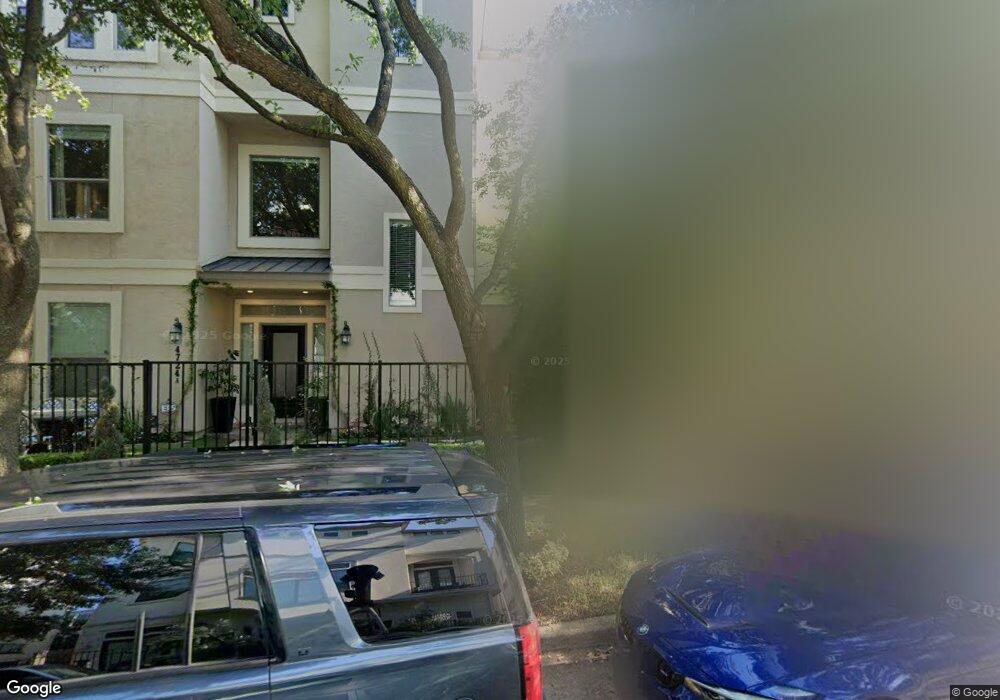
4720 Banning Dr Unit C Houston, TX 77027
Afton Oaks NeighborhoodEstimated Value: $772,954 - $1,066,000
4
Beds
4
Baths
2,883
Sq Ft
$311/Sq Ft
Est. Value
About This Home
This home is located at 4720 Banning Dr Unit C, Houston, TX 77027 and is currently estimated at $896,239, approximately $310 per square foot. 4720 Banning Dr Unit C is a home located in Harris County with nearby schools including School at St. George Place, Lanier Middle School, and Lamar High School.
Ownership History
Date
Name
Owned For
Owner Type
Purchase Details
Closed on
Jun 25, 2012
Sold by
Aronstein Alan
Bought by
Aronstein Alan
Current Estimated Value
Purchase Details
Closed on
Oct 4, 2007
Sold by
Sytronol S A
Bought by
Schweizer Boni
Purchase Details
Closed on
Apr 30, 2007
Sold by
Gelrud Saias M
Bought by
Sytronol S A
Purchase Details
Closed on
Dec 15, 2006
Sold by
Schweizer Boni
Bought by
Gelrud Saias M
Purchase Details
Closed on
May 27, 2005
Sold by
Hhn Homes Lp
Bought by
Schweizer Boni
Home Financials for this Owner
Home Financials are based on the most recent Mortgage that was taken out on this home.
Original Mortgage
$333,600
Interest Rate
5.83%
Mortgage Type
Fannie Mae Freddie Mac
Create a Home Valuation Report for This Property
The Home Valuation Report is an in-depth analysis detailing your home's value as well as a comparison with similar homes in the area
Home Values in the Area
Average Home Value in this Area
Purchase History
| Date | Buyer | Sale Price | Title Company |
|---|---|---|---|
| Aronstein Alan | -- | None Available | |
| Schweizer Boni | -- | None Available | |
| Sytronol S A | -- | None Available | |
| Gelrud Saias M | -- | None Available | |
| Schweizer Boni | -- | Stewart Title Company |
Source: Public Records
Mortgage History
| Date | Status | Borrower | Loan Amount |
|---|---|---|---|
| Previous Owner | Schweizer Boni | $333,600 | |
| Closed | Schweizer Boni | $62,550 |
Source: Public Records
Tax History Compared to Growth
Tax History
| Year | Tax Paid | Tax Assessment Tax Assessment Total Assessment is a certain percentage of the fair market value that is determined by local assessors to be the total taxable value of land and additions on the property. | Land | Improvement |
|---|---|---|---|---|
| 2025 | $4,480 | $728,752 | $229,713 | $499,039 |
| 2024 | $4,480 | $720,557 | $229,713 | $490,844 |
| 2023 | $4,480 | $630,083 | $229,713 | $400,370 |
| 2022 | $12,918 | $586,681 | $189,175 | $397,506 |
| 2021 | $13,598 | $583,422 | $189,175 | $394,247 |
| 2020 | $14,531 | $600,076 | $189,175 | $410,901 |
| 2019 | $15,185 | $600,076 | $189,175 | $410,901 |
| 2018 | $7,730 | $627,940 | $189,175 | $438,765 |
| 2017 | $14,253 | $627,940 | $189,175 | $438,765 |
| 2016 | $12,957 | $627,940 | $189,175 | $438,765 |
| 2015 | $6,381 | $571,274 | $135,125 | $436,149 |
| 2014 | $6,381 | $534,176 | $135,125 | $399,051 |
Source: Public Records
Map
Nearby Homes
- 4724 Banning Dr Unit A
- 4730 & 4734 Ivanhoe St
- 4622 Banning Dr
- 4711 Oakshire Dr
- 4734 Aftonshire Dr
- 4617 Devon St
- 0 Hidalgo St Unit 96571774
- 4506 Bryn Mawr Ln
- 3030 Post Oak Blvd Unit 808
- 5005 Hidalgo St Unit 312
- 5005 Hidalgo St Unit 210
- 5005 Hidalgo St Unit 413
- 5005 Hidalgo St Unit 601
- 4662 Richmond Ave
- 2047 Westcreek Ln Unit 1005
- 2902 W Lane Dr Unit A
- 2503 Mccue Rd Unit 5
- 2503 Mccue Rd Unit 6
- 4227 W Alabama St Unit 3
- 3410 Banbury Place
- 4720 Banning Dr Unit B
- 4720 Banning Dr Unit A
- 4720 Banning Dr
- 4724 Banning Dr Unit A
- 4724 Banning Dr Unit B
- 4724 Banning Dr Unit C
- 4724 Banning Dr Unit D
- 4724 Banning Dr Unit E
- 4724 Banning Dr Unit F
- 4724 Banning Dr Unit F
- 4724 Banning Dr
- 4724 Banning Dr
- 4724 Banning Dr
- 4714 Banning Dr
- 4715 Ivanhoe St
- 4747 Ivanhoe St
- 4725 Banning Dr
- 4723 Ivanhoe St
- 4721 Banning Dr
- 4721 Banning Dr Unit F