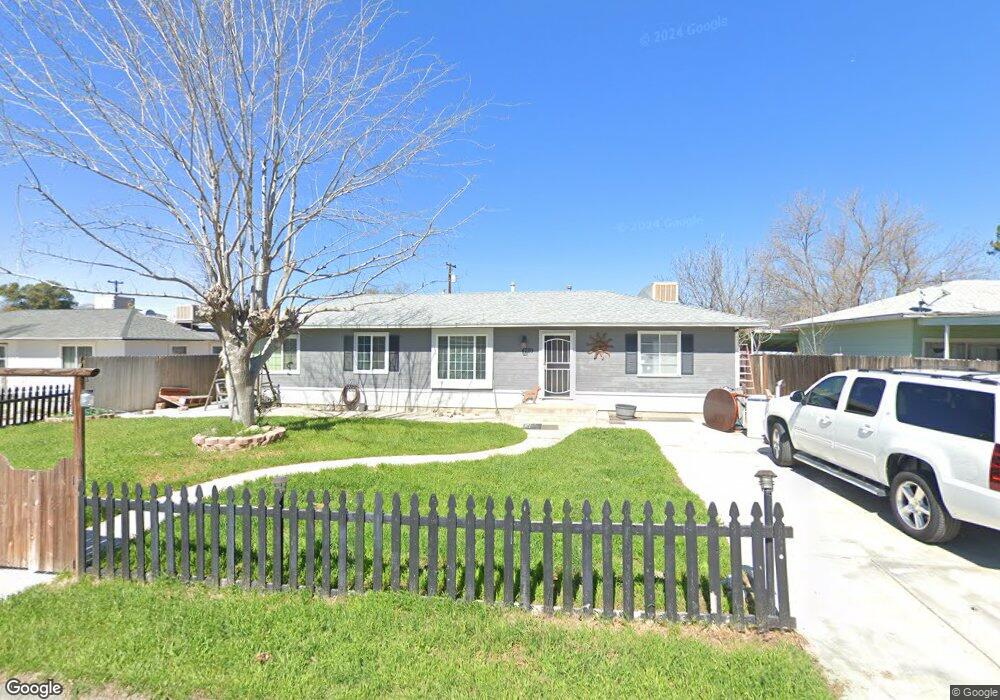
4720 Cebrian Ave Outside Area (Inside Ca), CA 93254
Estimated Value: $232,000 - $287,826
3
Beds
1
Bath
1,344
Sq Ft
$192/Sq Ft
Est. Value
About This Home
This home is located at 4720 Cebrian Ave, Outside Area (Inside Ca), CA 93254 and is currently estimated at $257,942, approximately $191 per square foot. 4720 Cebrian Ave is a home located in Santa Barbara County with nearby schools including Cuyama Elementary School, Cuyama Valley High School, and Olive Grove Charter.
Ownership History
Date
Name
Owned For
Owner Type
Purchase Details
Closed on
Feb 5, 2020
Sold by
Davis Sharon
Bought by
Boster Melinda Mae
Current Estimated Value
Purchase Details
Closed on
Jun 9, 2017
Sold by
Davis Phillip
Bought by
Davis Sharon
Purchase Details
Closed on
Jun 7, 2017
Sold by
Field Bobby and Field Nora
Bought by
Davis Sharon
Purchase Details
Closed on
Apr 2, 2009
Sold by
Us Bank National Association
Bought by
Field Bobby and Field Nora
Purchase Details
Closed on
Jan 16, 2009
Sold by
Cavanaugh Edwin R
Bought by
Us Bank National Association
Purchase Details
Closed on
Apr 6, 2005
Sold by
Sorenson Scott and Sorenson Jennifer
Bought by
Cavanugh Edwin R
Home Financials for this Owner
Home Financials are based on the most recent Mortgage that was taken out on this home.
Original Mortgage
$143,000
Interest Rate
6.75%
Mortgage Type
Purchase Money Mortgage
Create a Home Valuation Report for This Property
The Home Valuation Report is an in-depth analysis detailing your home's value as well as a comparison with similar homes in the area
Home Values in the Area
Average Home Value in this Area
Purchase History
| Date | Buyer | Sale Price | Title Company |
|---|---|---|---|
| Boster Melinda Mae | $125,000 | None Available | |
| Davis Sharon | -- | Fidelity National Title Co | |
| Davis Sharon | $150,000 | Fidelity National Title Co | |
| Field Bobby | $45,000 | First American Title Company | |
| Us Bank National Association | $55,000 | Accommodation | |
| Cavanugh Edwin R | $143,000 | First American Title Company |
Source: Public Records
Mortgage History
| Date | Status | Borrower | Loan Amount |
|---|---|---|---|
| Previous Owner | Cavanugh Edwin R | $143,000 |
Source: Public Records
Tax History
| Year | Tax Paid | Tax Assessment Tax Assessment Total Assessment is a certain percentage of the fair market value that is determined by local assessors to be the total taxable value of land and additions on the property. | Land | Improvement |
|---|---|---|---|---|
| 2025 | $1,907 | $174,978 | $43,743 | $131,235 |
| 2023 | $1,907 | $168,186 | $42,046 | $126,140 |
| 2022 | $1,840 | $164,889 | $41,222 | $123,667 |
| 2021 | $1,806 | $161,657 | $40,414 | $121,243 |
| 2020 | $1,762 | $159,180 | $31,836 | $127,344 |
| 2019 | $1,729 | $156,060 | $31,212 | $124,848 |
| 2018 | $1,688 | $153,000 | $30,600 | $122,400 |
| 2017 | $619 | $49,922 | $22,188 | $27,734 |
| 2016 | $580 | $48,944 | $21,753 | $27,191 |
| 2014 | $563 | $47,267 | $21,008 | $26,259 |
Source: Public Records
Map
Nearby Homes
- 4719 Cebrian Ave
- 4745 Cebrian Ave
- 4684 Cebrian Ave
- 4810 Cebrian Ave
- 4814 Cebrian Ave
- 4850 Cebrian Ave
- 4856 Morales St
- 65 Pato Ave
- 1220 Perkins Rd
- 166 Russell Ranch Rd
- 000 Perkins
- 00 Perkins
- 0 Bell Rd
- 1818 Aliso Canyon Rd
- 166 Russell Ranch Hwy
- 2968 Washington St
- 4055 El Roblar St
- 2170/7451 Aliso Park & Foothill Rd
- 7451 Foothill Rd
- 231 Castro Canyon Rd
- 4728 Cebrian Ave
- 4712 Cebrian Ave
- 4706 Cebrian Ave
- 4736 Cebrian Ave
- 4725 Morales St
- 4719 Morales St
- 4713 Morales St
- 4733 Morales St
- 4731 Cebrian Ave
- 4713 Cebrian Ave
- 4707 Morales St
- 4725 Cebrian Ave
- 0 Wasioja St
- 4744 Cebrian Ave
- 4696 Cebrian Ave
- 4737 Cebrian Ave
- 4707 Cebrian Ave
- 4695 Morales St
- 4752 Cebrian Ave
Your Personal Tour Guide
Ask me questions while you tour the home.