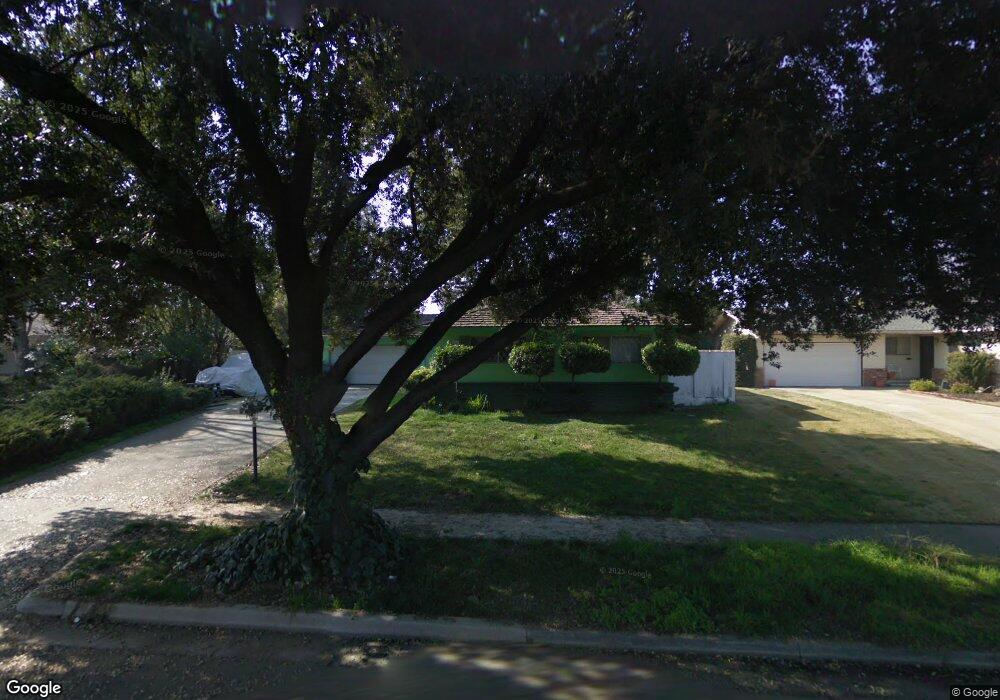
4721 N Bengston Ave Fresno, CA 93705
Bullard NeighborhoodEstimated Value: $329,153 - $394,000
3
Beds
2
Baths
1,520
Sq Ft
$244/Sq Ft
Est. Value
About This Home
This home is located at 4721 N Bengston Ave, Fresno, CA 93705 and is currently estimated at $371,288, approximately $244 per square foot. 4721 N Bengston Ave is a home located in Fresno County with nearby schools including Powers-Ginsburg Elementary, Bullard High School, and Aspen Valley Prep Academy.
Ownership History
Date
Name
Owned For
Owner Type
Purchase Details
Closed on
Aug 30, 1990
Sold by
Monson Peggy
Bought by
Monson Charles
Current Estimated Value
Create a Home Valuation Report for This Property
The Home Valuation Report is an in-depth analysis detailing your home's value as well as a comparison with similar homes in the area
Home Values in the Area
Average Home Value in this Area
Purchase History
| Date | Buyer | Sale Price | Title Company |
|---|---|---|---|
| Monson Charles | -- | -- |
Source: Public Records
Tax History Compared to Growth
Tax History
| Year | Tax Paid | Tax Assessment Tax Assessment Total Assessment is a certain percentage of the fair market value that is determined by local assessors to be the total taxable value of land and additions on the property. | Land | Improvement |
|---|---|---|---|---|
| 2025 | $1,792 | $142,139 | $48,725 | $93,414 |
| 2023 | $1,757 | $136,622 | $46,834 | $89,788 |
| 2022 | $1,734 | $133,944 | $45,916 | $88,028 |
| 2021 | $1,686 | $131,318 | $45,016 | $86,302 |
| 2020 | $1,679 | $129,973 | $44,555 | $85,418 |
| 2019 | $1,615 | $127,426 | $43,682 | $83,744 |
| 2018 | $1,580 | $124,928 | $42,826 | $82,102 |
| 2017 | $1,553 | $122,480 | $41,987 | $80,493 |
| 2016 | $1,502 | $120,079 | $41,164 | $78,915 |
| 2015 | $1,480 | $118,276 | $40,546 | $77,730 |
| 2014 | $1,450 | $115,960 | $39,752 | $76,208 |
Source: Public Records
Map
Nearby Homes
- 1763 W Santa Ana Ave
- 1749 W Santa Ana Ave
- 1751 W Santa Ana Ave
- 1705 W Santa Ana Ave
- 1410 W Rialto Ave
- 4837 N Ila Ave
- 4908 N Sequoia Ave Unit 102
- 4914 N Sequoia Dr
- 4848 N Hulbert Ave Unit 102
- 1866 W Santa Ana Ave Unit 101
- 1245 W Pico Ave
- 4856 N Hulbert Ave Unit 101
- 4880 N Hulbert Ave Unit 101
- 1484 W Indianapolis Ave
- 2013 W Fairmont Ave
- 4446 N Crystal Ave
- 2151 W Pico Ave
- 4442 N Hacienda Dr
- 1110 W Fairmont Ave
- 1027 W Ashcroft Ave
- 4735 N Bengston Ave
- 4717 N Bengston Ave
- 4720 N Crystal Ave
- 4734 N Crystal Ave
- 4716 N Crystal Ave
- 4741 N Bengston Ave
- 4689 N Bengston Ave
- 4722 N Bengston Ave
- 4718 N Bengston Ave
- 4736 N Bengston Ave
- 4740 N Crystal Ave
- 4688 N Crystal Ave
- 4742 N Bengston Ave
- 4690 N Bengston Ave
- 4753 N Bengston Ave
- 4679 N Bengston Ave
- 4752 N Crystal Ave
- 4678 N Crystal Ave
- 4723 N Warren Ave
- 4729 N Crystal Ave