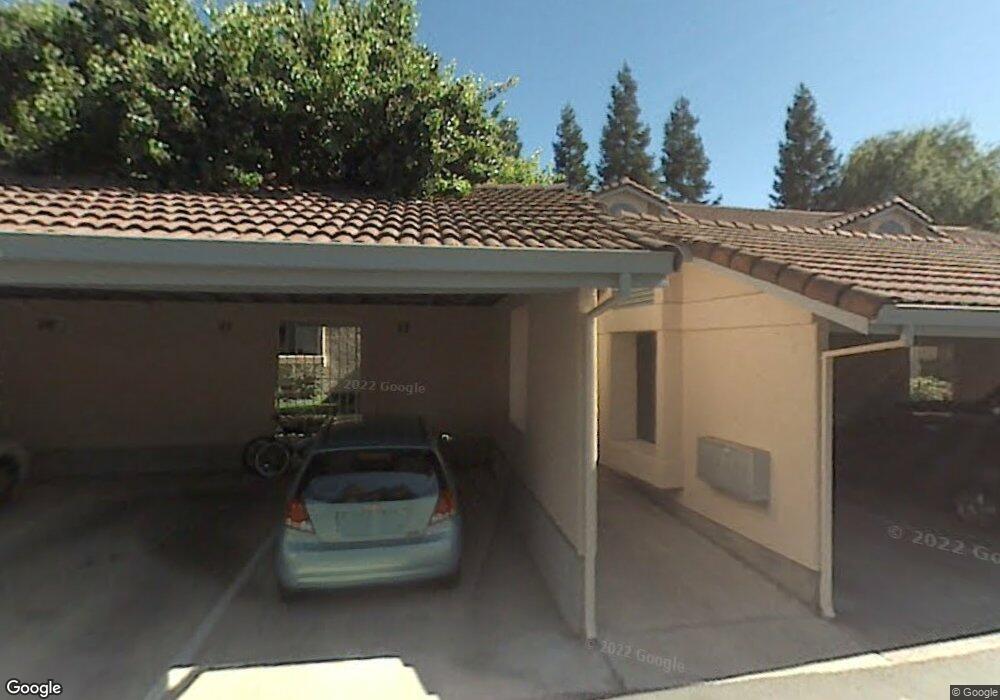
4721 Nicol Common Unit 104 Livermore, CA 94550
Estimated Value: $453,287 - $594,000
2
Beds
2
Baths
841
Sq Ft
$604/Sq Ft
Est. Value
About This Home
This home is located at 4721 Nicol Common Unit 104, Livermore, CA 94550 and is currently estimated at $507,822, approximately $603 per square foot. 4721 Nicol Common Unit 104 is a home located in Alameda County with nearby schools including Arroyo Seco Elementary School, East Avenue Middle School, and Livermore High School.
Ownership History
Date
Name
Owned For
Owner Type
Purchase Details
Closed on
Nov 27, 2012
Sold by
Jensen Arne Nygaard and Jensen Consolacion Diaz
Bought by
Jensen Arne N and Jensen Consolacion D
Current Estimated Value
Purchase Details
Closed on
Feb 11, 1999
Sold by
Koltavary Leslie D and Koltavary Susan M
Bought by
Jensen Arne Nygaard and Jensen Consolacion Diaz
Home Financials for this Owner
Home Financials are based on the most recent Mortgage that was taken out on this home.
Original Mortgage
$107,960
Outstanding Balance
$25,619
Interest Rate
6.77%
Mortgage Type
Purchase Money Mortgage
Estimated Equity
$482,203
Purchase Details
Closed on
Apr 8, 1996
Sold by
Debettencourt John J and Debettencourt Victoria Marie
Bought by
Koltavary Leslie D and Koltavary Susan M
Home Financials for this Owner
Home Financials are based on the most recent Mortgage that was taken out on this home.
Original Mortgage
$116,850
Interest Rate
7.41%
Mortgage Type
FHA
Create a Home Valuation Report for This Property
The Home Valuation Report is an in-depth analysis detailing your home's value as well as a comparison with similar homes in the area
Home Values in the Area
Average Home Value in this Area
Purchase History
| Date | Buyer | Sale Price | Title Company |
|---|---|---|---|
| Jensen Arne N | -- | None Available | |
| Jensen Arne Nygaard | $135,000 | First American Title | |
| Koltavary Leslie D | $120,500 | Fidelity National Title Ins |
Source: Public Records
Mortgage History
| Date | Status | Borrower | Loan Amount |
|---|---|---|---|
| Open | Jensen Arne Nygaard | $107,960 | |
| Previous Owner | Koltavary Leslie D | $116,850 |
Source: Public Records
Tax History Compared to Growth
Tax History
| Year | Tax Paid | Tax Assessment Tax Assessment Total Assessment is a certain percentage of the fair market value that is determined by local assessors to be the total taxable value of land and additions on the property. | Land | Improvement |
|---|---|---|---|---|
| 2025 | $3,343 | $211,628 | $63,488 | $148,140 |
| 2024 | $3,343 | $207,480 | $62,244 | $145,236 |
| 2023 | $3,280 | $203,411 | $61,023 | $142,388 |
| 2022 | $3,220 | $199,424 | $59,827 | $139,597 |
| 2021 | $3,146 | $195,514 | $58,654 | $136,860 |
| 2020 | $3,023 | $193,510 | $58,053 | $135,457 |
| 2019 | $3,003 | $189,716 | $56,915 | $132,801 |
| 2018 | $2,929 | $185,997 | $55,799 | $130,198 |
| 2017 | $2,848 | $182,350 | $54,705 | $127,645 |
| 2016 | $2,652 | $178,775 | $53,632 | $125,143 |
| 2015 | $2,519 | $176,090 | $52,827 | $123,263 |
| 2014 | $2,487 | $172,641 | $51,792 | $120,849 |
Source: Public Records
Map
Nearby Homes
- 4844 Mulqueeney Common
- 4674 Kimberley Common
- 368 Beverly St
- 476 Beverly St
- 473 Andrea Cir
- 4382 Colgate Way
- 766 Joyce St
- 591 Debra St
- 736 Adams Ave
- 838 Hazel St
- 4715 Marengo Common
- 4711 Marengo Common
- Residence 3 Plan at Amara at Arroyo Crossings
- Residence 2 Plan at Amara at Arroyo Crossings
- Residence 1 Plan at Amara at Arroyo Crossings
- 4898 Las Positas Rd
- 5157 Diane Ln
- 1377 Lillian St
- 202 Sonia Way
- 4605 Vilana St
- 4721 Nicol Cm Unit 13
- 4721 Nicol Common Unit 105
- 4721 Nicol Common Unit 106
- 4721 Nicol Common Unit 108
- 4721 Nicol Common Unit 107
- 4721 Nicol Common Unit 110
- 4721 Nicol Common Unit 109
- 4721 Nicol Common Unit 112
- 4721 Nicol Common Unit 111
- 4721 Nicol Common Unit 102
- 4721 Nicol Common Unit 101
- 4721 Nicol Common Unit 103
- 4749 Nicol Common Unit 102
- 4749 Nicol Common Unit 101
- 4749 Nicol Common Unit 106
- 4749 Nicol Common Unit 103
- 4749 Nicol Common Unit 104
- 4749 Nicol Common Unit 105
- 4749 Nicol Common Unit 108
- 4749 Nicol Common Unit 107