Estimated Value: $223,000 - $320,000
--
Bed
--
Bath
832
Sq Ft
$324/Sq Ft
Est. Value
About This Home
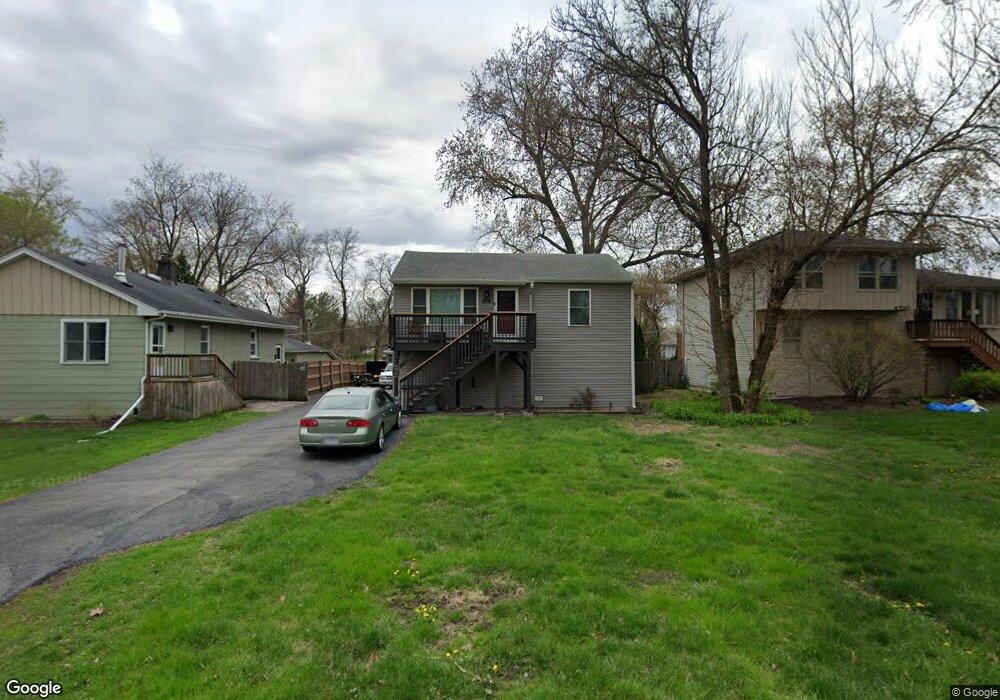
This home is located at 4722 Mckinley Ave, Lisle, IL 60532 and is currently estimated at $269,754, approximately $324 per square foot. 4722 Mckinley Ave is a home located in DuPage County with nearby schools including Lisle Elementary School, William Harris Elementary School, and Lisle Jr High School.
Ownership History
Date
Name
Owned For
Owner Type
Purchase Details
Closed on
Oct 19, 2000
Sold by
Reilly Stephen and Reilly Kimberly A
Bought by
Samstag Earl C
Current Estimated Value
Home Financials for this Owner
Home Financials are based on the most recent Mortgage that was taken out on this home.
Original Mortgage
$113,200
Outstanding Balance
$41,401
Interest Rate
7.96%
Estimated Equity
$228,353
Purchase Details
Closed on
May 20, 1999
Sold by
Reilly Kimberly A
Bought by
Reilly Stephen and Reilly Kimberly A
Home Financials for this Owner
Home Financials are based on the most recent Mortgage that was taken out on this home.
Original Mortgage
$103,528
Interest Rate
6.99%
Mortgage Type
FHA
Purchase Details
Closed on
Aug 29, 1997
Sold by
Reilly Stephen M and Antos Kimberly A
Bought by
Reilly Kimberly A
Home Financials for this Owner
Home Financials are based on the most recent Mortgage that was taken out on this home.
Original Mortgage
$97,500
Interest Rate
11.5%
Create a Home Valuation Report for This Property
The Home Valuation Report is an in-depth analysis detailing your home's value as well as a comparison with similar homes in the area
Home Values in the Area
Average Home Value in this Area
Purchase History
| Date | Buyer | Sale Price | Title Company |
|---|---|---|---|
| Samstag Earl C | $141,500 | Law Title Pick Up | |
| Reilly Stephen | -- | Stewart Title | |
| Reilly Kimberly A | -- | -- |
Source: Public Records
Mortgage History
| Date | Status | Borrower | Loan Amount |
|---|---|---|---|
| Open | Samstag Earl C | $113,200 | |
| Previous Owner | Reilly Stephen | $103,528 | |
| Previous Owner | Reilly Kimberly A | $97,500 | |
| Closed | Samstag Earl C | $14,150 |
Source: Public Records
Tax History Compared to Growth
Tax History
| Year | Tax Paid | Tax Assessment Tax Assessment Total Assessment is a certain percentage of the fair market value that is determined by local assessors to be the total taxable value of land and additions on the property. | Land | Improvement |
|---|---|---|---|---|
| 2024 | $4,212 | $65,940 | $28,631 | $37,309 |
| 2023 | $4,006 | $60,180 | $26,130 | $34,050 |
| 2022 | $3,387 | $50,880 | $22,090 | $28,790 |
| 2021 | $3,277 | $48,950 | $21,250 | $27,700 |
| 2020 | $3,136 | $48,070 | $20,870 | $27,200 |
| 2019 | $3,072 | $45,990 | $19,970 | $26,020 |
| 2018 | $2,962 | $45,990 | $19,970 | $26,020 |
| 2017 | $2,924 | $44,440 | $19,300 | $25,140 |
| 2016 | $2,845 | $42,830 | $18,600 | $24,230 |
| 2015 | $2,791 | $40,340 | $17,520 | $22,820 |
| 2014 | $2,756 | $38,470 | $17,520 | $20,950 |
| 2013 | $2,093 | $31,210 | $17,560 | $13,650 |
Source: Public Records
Map
Nearby Homes
- 1510A Burlington Ave
- 4703 Garfield Ave
- 1203 Lisle Place
- 1161 Lisle Place
- 1632 Ogden Ave
- 4714 Schwartz Ave
- 1002 Ogden Ave
- Lots 002 and 003 Route 53
- 916 Lacey Ave
- 000 Main St
- 4601 Winchester Ave
- 752 Ogden Ave
- 748 Ogden Ave
- 2004 Burlington Ave
- 6235 Lafond Cir
- 6219 Rivers Edge Dr
- 6280 Lee Ct
- 6284 Lee Ct
- 6260 Lafond Cir
- 6269 Lafond Cir
- 4720 Mckinley Ave
- 4724 Mckinley Ave
- 4718 Mckinley Ave
- 4726 Mckinley Ave
- 4723 Dumoulin Ave
- 4719 Dumoulin Ave
- 4716 Mckinley Ave
- 4728 Mckinley Ave
- 4721 Mckinley Ave
- 4719 Mckinley Ave
- 4723 Mckinley Ave
- 4727 Dumoulin Ave
- 4714 Mckinley Ave
- 4715 Dumoulin Ave
- 4732 Mckinley Ave
- 4717 Mckinley Ave
- 4725 Mckinley Ave
- 4727 Mckinley Ave
- 4713 Dumoulin Ave