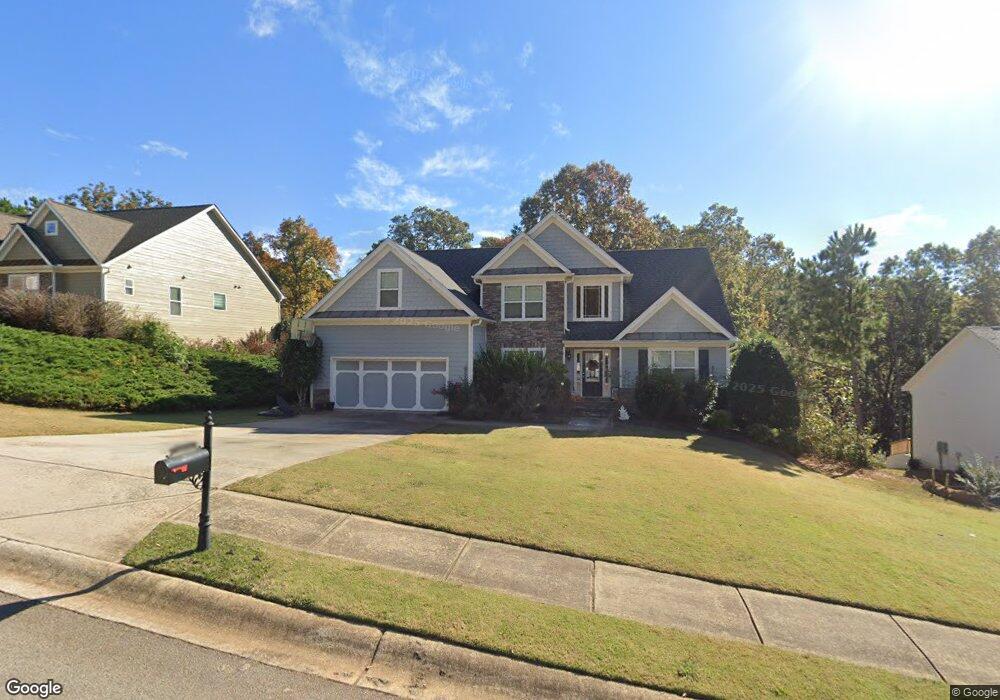
4722 Shady Lake Cir Unit 10 Gainesville, GA 30507
Estimated Value: $491,000 - $569,000
4
Beds
3
Baths
2,543
Sq Ft
$207/Sq Ft
Est. Value
About This Home
This home is located at 4722 Shady Lake Cir Unit 10, Gainesville, GA 30507 and is currently estimated at $525,455, approximately $206 per square foot. 4722 Shady Lake Cir Unit 10 is a home located in Hall County with nearby schools including Chestnut Mountain Elementary School, Cherokee Bluff Middle School, and Cherokee Bluff High School.
Ownership History
Date
Name
Owned For
Owner Type
Purchase Details
Closed on
May 10, 2016
Sold by
Reed Timothy S
Bought by
Behbahani Zain A
Current Estimated Value
Home Financials for this Owner
Home Financials are based on the most recent Mortgage that was taken out on this home.
Original Mortgage
$260,380
Outstanding Balance
$206,739
Interest Rate
3.58%
Mortgage Type
VA
Estimated Equity
$318,716
Purchase Details
Closed on
May 30, 2008
Sold by
Georgian Acres Builders Inc
Bought by
Pomrenke Laura and Reed Timothy
Home Financials for this Owner
Home Financials are based on the most recent Mortgage that was taken out on this home.
Original Mortgage
$39,150
Interest Rate
6%
Mortgage Type
New Conventional
Purchase Details
Closed on
Apr 10, 2007
Sold by
Balata Development Corporation
Bought by
Georgian Acres Builders Inc
Home Financials for this Owner
Home Financials are based on the most recent Mortgage that was taken out on this home.
Original Mortgage
$1,043,250
Interest Rate
6.15%
Create a Home Valuation Report for This Property
The Home Valuation Report is an in-depth analysis detailing your home's value as well as a comparison with similar homes in the area
Home Values in the Area
Average Home Value in this Area
Purchase History
| Date | Buyer | Sale Price | Title Company |
|---|---|---|---|
| Behbahani Zain A | $254,900 | -- | |
| Pomrenke Laura | $261,000 | -- | |
| Georgian Acres Builders Inc | $280,000 | -- |
Source: Public Records
Mortgage History
| Date | Status | Borrower | Loan Amount |
|---|---|---|---|
| Open | Behbahani Zain A | $260,380 | |
| Previous Owner | Pomrenke Laura | $39,150 | |
| Previous Owner | Pomrenke Laura | $208,800 | |
| Previous Owner | Georgian Acres Builders Inc | $1,043,250 |
Source: Public Records
Tax History Compared to Growth
Tax History
| Year | Tax Paid | Tax Assessment Tax Assessment Total Assessment is a certain percentage of the fair market value that is determined by local assessors to be the total taxable value of land and additions on the property. | Land | Improvement |
|---|---|---|---|---|
| 2024 | $4,538 | $178,200 | $32,000 | $146,200 |
| 2023 | $4,136 | $177,640 | $31,320 | $146,320 |
| 2022 | $4,369 | $164,480 | $28,640 | $135,840 |
| 2021 | $3,964 | $146,000 | $13,240 | $132,760 |
| 2020 | $3,872 | $138,480 | $13,240 | $125,240 |
| 2019 | $3,412 | $120,400 | $17,080 | $103,320 |
| 2018 | $3,242 | $110,520 | $10,440 | $100,080 |
| 2017 | $2,962 | $101,720 | $11,440 | $90,280 |
| 2016 | $2,893 | $101,720 | $11,440 | $90,280 |
| 2015 | $2,074 | $71,170 | $9,920 | $61,250 |
| 2014 | $2,074 | $71,170 | $9,920 | $61,250 |
Source: Public Records
Map
Nearby Homes
- 4745 Shady Lake Cir
- 4813 River Bottom Dr
- 5354 Shadow Walk Way
- 4807 Sherman Allen Rd
- 4715 Creek Wood Dr
- 5321 Shadow Walk Way
- 5526 Woodstream Ct
- 3945 Kilgore Falls Dr
- 5339 Milford Dr
- 5339 Milford Dr Unit 205A
- 3325 Tanners Mill Rd
- 4947 Weaver Rd
- 5326 Windridge Pkwy Unit 19A
- 5326 Windridge Pkwy
- 5322 Windridge Pkwy Unit 18A
- 5239 Baymont Dr
- 5239 Baymont Dr Unit 164A
- Kingston Plan at Ponderosa Farms - Reserve
- Canterbury Plan at Ponderosa Farms - Reserve
- Canterbury Plan at Ponderosa Farms - Manor
- 4722 Shady Lake Cir
- 4726 Shady Lake Cir
- 0 Shady Lake Dr Unit 3242035
- 0 Shady Lake Dr Unit 3991657
- 0 Shady Lake Dr Unit 3991625
- 0 Shady Lake Dr Unit 4089381
- 0 Shady Lake Dr Unit 5028870
- 0 Shady Lake Cir Unit 8704134
- 0 Shady Lake Cir Unit 8291074
- 0 Shady Lake Cir Unit 8039962
- 0 Shady Lake Dr Unit 3134741
- 0 Shady Lake Dr Unit 3134740
- 0 Shady Lake Dr Unit 3132726
- 0 Shady Lake Cir Unit 8935330
- 0 Shady Lake Cir Unit 3128345
- 0 Shady Lake Cir Unit 3289466
- 0 Shady Lake Cir Unit 7134064
- 0 Shady Lake Cir Unit 7190457
- 0 Shady Lake Cir
- 4718 Shady Lake Cir