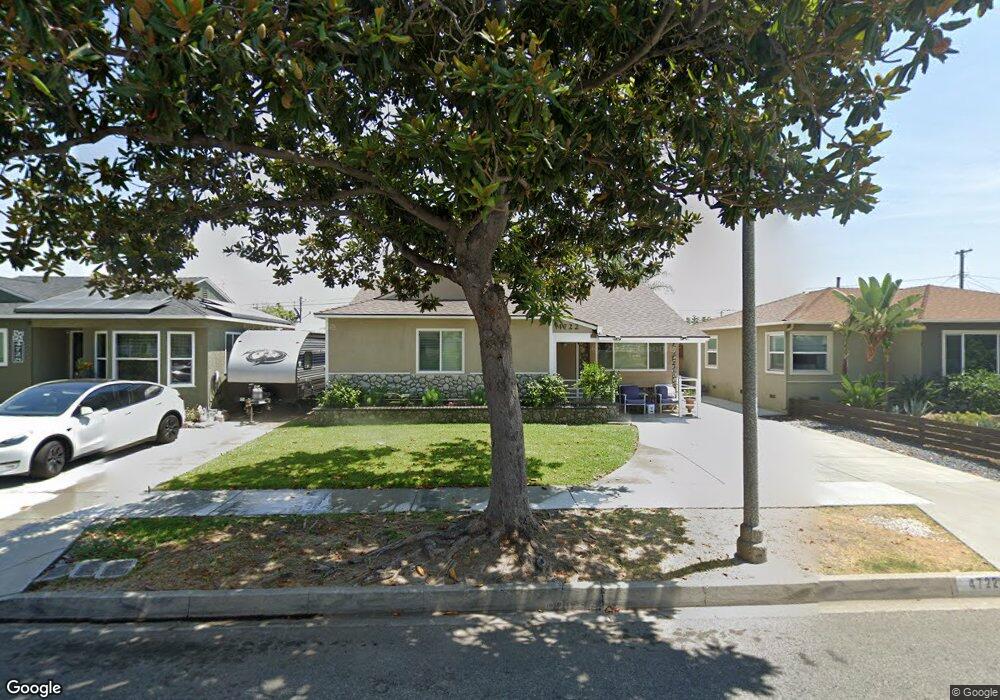
4722 Vangold Ave Lakewood, CA 90712
Lakewood Mutual NeighborhoodEstimated Value: $914,119 - $983,000
3
Beds
2
Baths
1,764
Sq Ft
$537/Sq Ft
Est. Value
About This Home
This home is located at 4722 Vangold Ave, Lakewood, CA 90712 and is currently estimated at $948,030, approximately $537 per square foot. 4722 Vangold Ave is a home located in Los Angeles County with nearby schools including Riley Elementary School, Hoover Middle School, and Lakewood High School.
Ownership History
Date
Name
Owned For
Owner Type
Purchase Details
Closed on
Jul 18, 2018
Sold by
Thao Nguyen Thi Phuong
Bought by
Nguyen Phuong Thao Thi and The Phuong Thao Thi Nguyen Liv
Current Estimated Value
Purchase Details
Closed on
Jul 13, 2018
Sold by
Tu Chau Kha and Thao Nguyen Thi Phuong
Bought by
Thao Nguyen Thi Phuong
Purchase Details
Closed on
Jun 8, 2009
Sold by
Caldreon Juan Maurice
Bought by
Tu Chau Kha
Purchase Details
Closed on
May 18, 2009
Sold by
Nelson Brian E
Bought by
Tu Chau Kha
Purchase Details
Closed on
Apr 26, 2000
Sold by
Sarfati John
Bought by
Nelson Brian E and Nelson Lina B
Home Financials for this Owner
Home Financials are based on the most recent Mortgage that was taken out on this home.
Original Mortgage
$233,700
Interest Rate
8.08%
Create a Home Valuation Report for This Property
The Home Valuation Report is an in-depth analysis detailing your home's value as well as a comparison with similar homes in the area
Home Values in the Area
Average Home Value in this Area
Purchase History
| Date | Buyer | Sale Price | Title Company |
|---|---|---|---|
| Nguyen Phuong Thao Thi | -- | None Available | |
| Thao Nguyen Thi Phuong | -- | None Available | |
| Tu Chau Kha | -- | Nations Title Company | |
| Tu Chau Kha | -- | Nations Title Company | |
| Tu Chau Kha | $450,000 | None Available | |
| Nelson Brian E | $246,000 | Chicago Title |
Source: Public Records
Mortgage History
| Date | Status | Borrower | Loan Amount |
|---|---|---|---|
| Previous Owner | Nelson Brian E | $233,700 |
Source: Public Records
Tax History Compared to Growth
Tax History
| Year | Tax Paid | Tax Assessment Tax Assessment Total Assessment is a certain percentage of the fair market value that is determined by local assessors to be the total taxable value of land and additions on the property. | Land | Improvement |
|---|---|---|---|---|
| 2025 | $7,977 | $603,128 | $454,932 | $148,196 |
| 2024 | $7,977 | $591,303 | $446,012 | $145,291 |
| 2023 | $7,845 | $579,710 | $437,267 | $142,443 |
| 2022 | $7,373 | $568,344 | $428,694 | $139,650 |
| 2021 | $7,227 | $557,201 | $420,289 | $136,912 |
| 2020 | $7,206 | $551,489 | $415,980 | $135,509 |
| 2019 | $5,544 | $410,144 | $286,848 | $123,296 |
| 2018 | $5,337 | $402,103 | $281,224 | $120,879 |
| 2016 | $4,910 | $386,490 | $270,304 | $116,186 |
| 2015 | $4,720 | $380,685 | $266,244 | $114,441 |
| 2014 | $4,688 | $373,229 | $261,029 | $112,200 |
Source: Public Records
Map
Nearby Homes
- 4700 Clair Del Ave Unit 538
- 2803 Frankel St
- 2523 Allred St
- 2729 Greentop St
- 4328 Deeboyar Ave
- 4559 Levelside Ave
- 2912 Allred St
- 3244 Centralia St
- 2922 Eckleson St
- 2912 Yearling St
- 2918 Yearling St
- 2739 Denmead St
- 5016 Falcon Ave
- 4155 Rose Ave
- 4251 Gundry Ave
- 3638 Sandwood St
- 5024 N Bentree Cir
- 1648 E Plymouth St
- 4944 Coke Ave
- 1124 E Ridgewood St
- 4728 Vangold Ave
- 4718 Vangold Ave
- 4725 Pixie Ave
- 4732 Vangold Ave
- 4712 Vangold Ave
- 4719 Pixie Ave
- 4729 Pixie Ave
- 4713 Pixie Ave
- 4733 Pixie Ave
- 4706 Vangold Ave
- 4727 Vangold Ave
- 4721 Vangold Ave
- 4731 Vangold Ave
- 4715 Vangold Ave
- 4709 Pixie Ave
- 4739 Pixie Ave
- 4737 Vangold Ave
- 4702 Vangold Ave
- 4742 Vangold Ave
- 4711 Vangold Ave