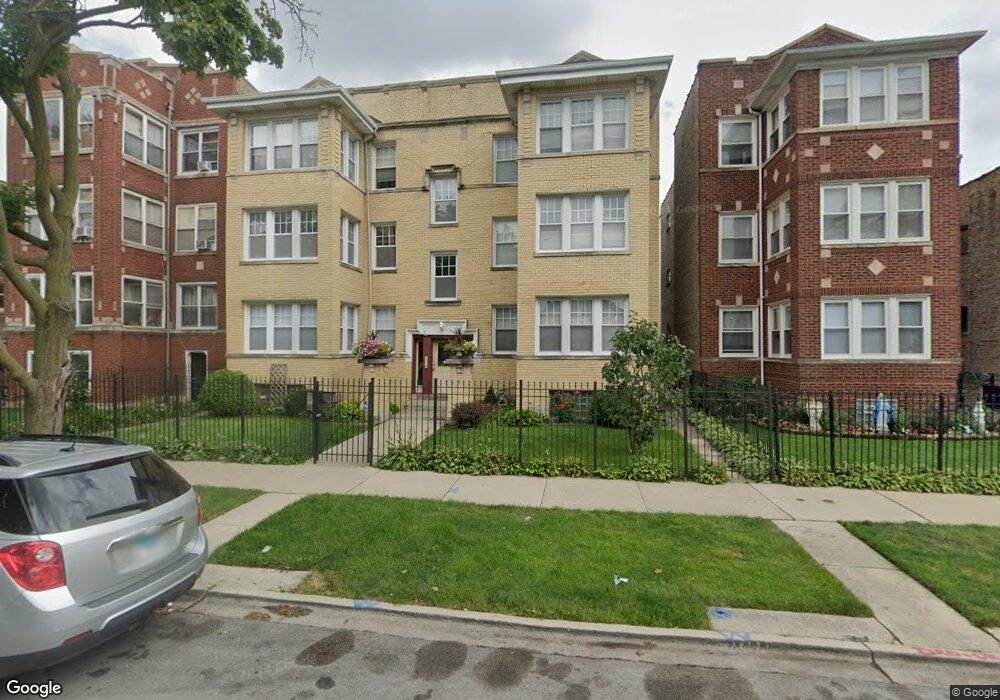
4723 N Drake Ave Unit 47231 Chicago, IL 60625
Albany Park NeighborhoodEstimated Value: $319,000 - $354,000
2
Beds
2
Baths
1,450
Sq Ft
$230/Sq Ft
Est. Value
About This Home
This home is located at 4723 N Drake Ave Unit 47231, Chicago, IL 60625 and is currently estimated at $333,146, approximately $229 per square foot. 4723 N Drake Ave Unit 47231 is a home located in Cook County with nearby schools including Haugan Elementary School, Roosevelt High School, and ASPIRA Haugan Middle School.
Ownership History
Date
Name
Owned For
Owner Type
Purchase Details
Closed on
Oct 25, 2022
Sold by
Bostrom Daniel and Bostrom Anne
Bought by
King Meeae Song
Current Estimated Value
Home Financials for this Owner
Home Financials are based on the most recent Mortgage that was taken out on this home.
Original Mortgage
$228,000
Outstanding Balance
$220,601
Interest Rate
6.7%
Mortgage Type
New Conventional
Estimated Equity
$112,546
Purchase Details
Closed on
Aug 5, 2016
Sold by
Spreen Chad J and Spreen Nicole
Bought by
Bostrom Daniel and Bostrom Anne
Home Financials for this Owner
Home Financials are based on the most recent Mortgage that was taken out on this home.
Original Mortgage
$185,725
Interest Rate
3.75%
Mortgage Type
New Conventional
Purchase Details
Closed on
Oct 27, 2000
Sold by
4719 N Drake Llc
Bought by
Bloom Michael F and Bloom Diane M W
Home Financials for this Owner
Home Financials are based on the most recent Mortgage that was taken out on this home.
Original Mortgage
$145,900
Interest Rate
7.91%
Create a Home Valuation Report for This Property
The Home Valuation Report is an in-depth analysis detailing your home's value as well as a comparison with similar homes in the area
Home Values in the Area
Average Home Value in this Area
Purchase History
| Date | Buyer | Sale Price | Title Company |
|---|---|---|---|
| King Meeae Song | $285,000 | Stewart Title Guaranty Company | |
| Bostrom Daniel | $218,500 | Fidelity National Title | |
| Bloom Michael F | -- | -- |
Source: Public Records
Mortgage History
| Date | Status | Borrower | Loan Amount |
|---|---|---|---|
| Open | King Meeae Song | $228,000 | |
| Previous Owner | Bostrom Daniel | $185,725 | |
| Previous Owner | Bloom Michael F | $145,900 |
Source: Public Records
Tax History Compared to Growth
Tax History
| Year | Tax Paid | Tax Assessment Tax Assessment Total Assessment is a certain percentage of the fair market value that is determined by local assessors to be the total taxable value of land and additions on the property. | Land | Improvement |
|---|---|---|---|---|
| 2024 | $3,744 | $26,898 | $3,976 | $22,922 |
| 2023 | $3,628 | $21,000 | $3,180 | $17,820 |
| 2022 | $3,628 | $21,000 | $3,180 | $17,820 |
| 2021 | $3,565 | $20,999 | $3,180 | $17,819 |
| 2020 | $3,366 | $18,162 | $1,646 | $16,516 |
| 2019 | $3,412 | $20,353 | $1,646 | $18,707 |
| 2018 | $3,353 | $20,353 | $1,646 | $18,707 |
| 2017 | $2,619 | $15,503 | $1,476 | $14,027 |
| 2016 | $2,614 | $15,503 | $1,476 | $14,027 |
| 2015 | $2,368 | $15,503 | $1,476 | $14,027 |
| 2014 | $2,799 | $17,600 | $1,363 | $16,237 |
| 2013 | $3,696 | $22,876 | $1,363 | $21,513 |
Source: Public Records
Map
Nearby Homes
- 4734 N Drake Ave
- 4621 N Monticello Ave
- 4619 N Lawndale Ave Unit 1
- 3711 W Lawrence Ave
- 4534 N Saint Louis Ave
- 4906 N Drake Ave Unit 3
- 4903 N Monticello Ave Unit 3
- 3618 W Ainslie St Unit 3W
- 4900 N Lawndale Ave Unit G
- 4919 N Lawndale Ave
- 4938 N Central Park Ave
- 4714 N Spaulding Ave
- 4426 N Drake Ave
- 4948 N Kimball Ave Unit 4W
- 4515 N Hamlin Ave
- 3733 W Sunnyside Ave
- 3550 W Montrose Ave Unit 107
- 5007 N Lawndale Ave
- 3210 W Lawrence Ave
- 4944 N Spaulding Ave Unit 4944
- 4719 N Drake Ave
- 4719 N Drake Ave Unit 47191
- 4719 N Drake Ave Unit 47193
- 4719 N Drake Ave Unit 47192
- 4719 N Drake Ave Unit 1S
- 4719 N Drake Ave Unit 2
- 4723 N Drake Ave Unit 3
- 4723 N Drake Ave Unit 47233
- 4723 N Drake Ave Unit 47232
- 4723 N Drake Ave Unit 1
- 4717 N Drake Ave
- 4717 N Drake Ave Unit 2
- 4725 N Drake Ave Unit 1
- 4725 N Drake Ave
- 4713 N Drake Ave
- 4713 N Drake Ave Unit 1
- 4713 N Drake Ave
- 4729 N Drake Ave Unit 2
- 4729 N Drake Ave
- 4711 N Drake Ave Unit 2