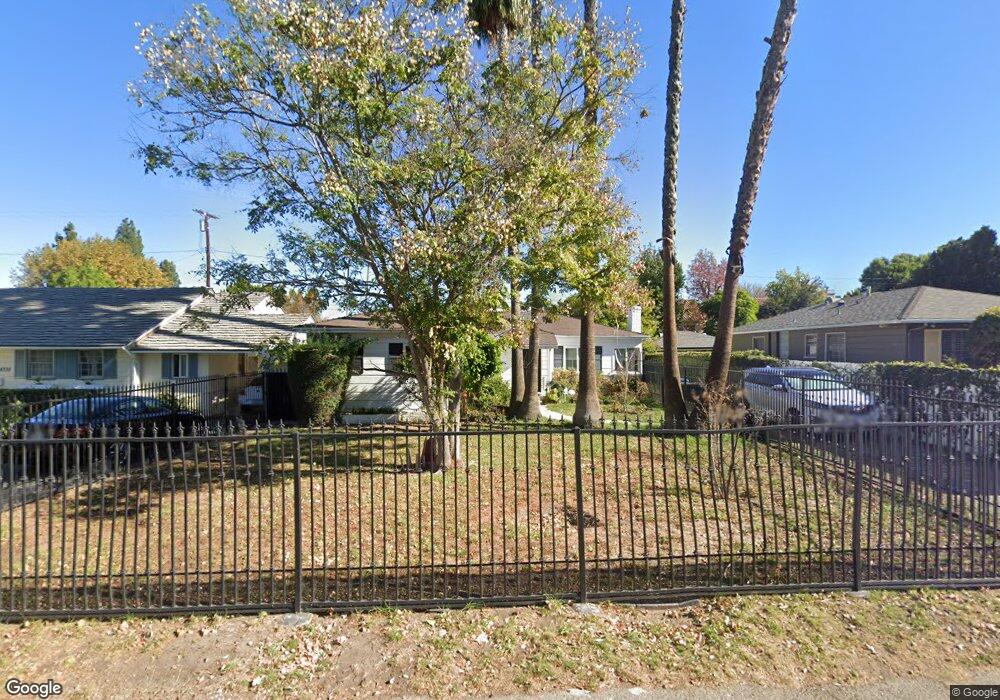
4724 Columbus Ave Sherman Oaks, CA 91403
Estimated Value: $1,400,000 - $3,377,000
2
Beds
2
Baths
1,681
Sq Ft
$1,148/Sq Ft
Est. Value
About This Home
This home is located at 4724 Columbus Ave, Sherman Oaks, CA 91403 and is currently estimated at $1,929,554, approximately $1,147 per square foot. 4724 Columbus Ave is a home located in Los Angeles County with nearby schools including Van Nuys High School, Ivy Bound Academy of Math Sci and Tech Charter Middle, and Sherman Oaks Elementary Charter School.
Ownership History
Date
Name
Owned For
Owner Type
Purchase Details
Closed on
Mar 4, 2002
Sold by
Vanallan Richard
Bought by
Vanallan Cynthia and Vanallan Trust Of 1999
Current Estimated Value
Purchase Details
Closed on
Nov 13, 2001
Sold by
Vanallan Cynthia
Bought by
Vanallan Richard
Purchase Details
Closed on
Nov 16, 1999
Sold by
Vanallan Richard J
Bought by
Vanallan Cynthia and Vanallan Trust Of 1999
Purchase Details
Closed on
Oct 17, 1995
Sold by
Walpin Lionel A
Bought by
Vanallen Richard James
Home Financials for this Owner
Home Financials are based on the most recent Mortgage that was taken out on this home.
Original Mortgage
$168,000
Interest Rate
7.59%
Purchase Details
Closed on
Oct 30, 1993
Sold by
Walpin Lionel Arthur
Bought by
Walpin Lionel A and Lionel A Walpin Trust
Create a Home Valuation Report for This Property
The Home Valuation Report is an in-depth analysis detailing your home's value as well as a comparison with similar homes in the area
Home Values in the Area
Average Home Value in this Area
Purchase History
| Date | Buyer | Sale Price | Title Company |
|---|---|---|---|
| Vanallan Cynthia | -- | -- | |
| Vanallan Richard | -- | First American Title Co | |
| Vanallan Cynthia | -- | -- | |
| Vanallen Richard James | $210,000 | First American Title Co | |
| Walpin Lionel A | -- | -- |
Source: Public Records
Mortgage History
| Date | Status | Borrower | Loan Amount |
|---|---|---|---|
| Previous Owner | Vanallen Richard James | $168,000 |
Source: Public Records
Tax History Compared to Growth
Tax History
| Year | Tax Paid | Tax Assessment Tax Assessment Total Assessment is a certain percentage of the fair market value that is determined by local assessors to be the total taxable value of land and additions on the property. | Land | Improvement |
|---|---|---|---|---|
| 2025 | $4,372 | $348,837 | $266,454 | $82,383 |
| 2024 | $4,372 | $341,998 | $261,230 | $80,768 |
| 2023 | $4,290 | $335,293 | $256,108 | $79,185 |
| 2022 | $4,094 | $328,720 | $251,087 | $77,633 |
| 2021 | $4,037 | $322,275 | $246,164 | $76,111 |
| 2020 | $4,075 | $318,971 | $243,640 | $75,331 |
| 2019 | $3,919 | $312,717 | $238,863 | $73,854 |
| 2018 | $3,862 | $306,586 | $234,180 | $72,406 |
| 2016 | $3,678 | $294,684 | $225,088 | $69,596 |
| 2015 | $3,626 | $290,258 | $221,707 | $68,551 |
| 2014 | $3,646 | $284,574 | $217,365 | $67,209 |
Source: Public Records
Map
Nearby Homes
- 4724 Halbrent Ave
- 4748 Noble Ave
- 15234 1/4 Dickens St
- 14948 Moorpark St
- 15241 Greenleaf St
- 15217 Greenleaf St
- 14923 Moorpark St Unit 103
- 15231 Greenleaf St
- 4551 Kester Ave Unit 1
- 4724 Kester Ave Unit 209
- 4724 Kester Ave Unit 404
- 4724 Kester Ave Unit 410
- 15027 Ventura Blvd
- 15457 Moorpark St Unit 1
- 14947 Dickens St Unit 3
- 4707 Willis Ave Unit 110
- 14919 Dickens St Unit 104
- 14934 Dickens St Unit 19
- 4401 Sepulveda Blvd Unit 208
- 14812 Morrison St
- 4718 Columbus Ave
- 4730 Columbus Ave
- 4712 Columbus Ave
- 4736 Columbus Ave
- 4725 Burnet Ave
- 4731 Burnet Ave
- 4719 Burnet Ave
- 4713 Burnet Ave
- 4737 Burnet Ave
- 4706 Columbus Ave
- 4742 Columbus Ave
- 4725 Columbus Ave
- 4719 Columbus Ave
- 4731 Columbus Ave
- 4729 Columbus Ave
- 4707 Burnet Ave
- 4713 Columbus Ave
- 4745 Burnet Ave
- 4700 Columbus Ave
- 4748 Columbus Ave