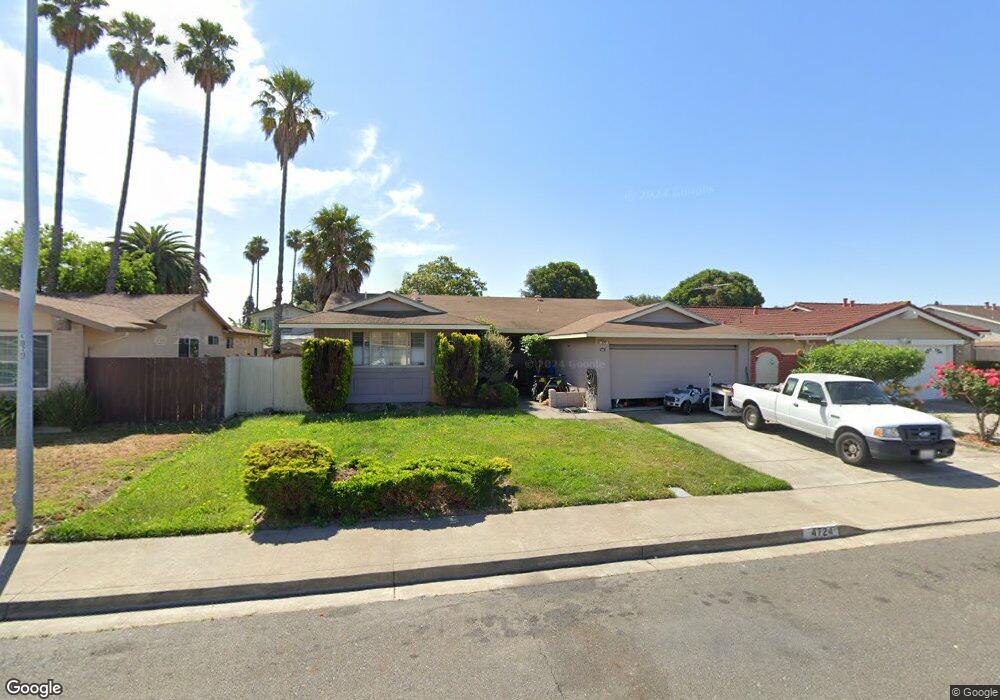
4724 Darlene Ct Union City, CA 94587
Alvarado NeighborhoodEstimated Value: $1,039,000 - $1,439,222
4
Beds
2
Baths
1,566
Sq Ft
$832/Sq Ft
Est. Value
About This Home
This home is located at 4724 Darlene Ct, Union City, CA 94587 and is currently estimated at $1,303,556, approximately $832 per square foot. 4724 Darlene Ct is a home located in Alameda County with nearby schools including Delaine Eastin Elementary School, Itliong-Vera Cruz, and James Logan High School.
Ownership History
Date
Name
Owned For
Owner Type
Purchase Details
Closed on
Sep 3, 2003
Sold by
Flora Harminder and Flora Parmjit
Bought by
Dulay Manjit S and Dulay Charanjit K
Current Estimated Value
Home Financials for this Owner
Home Financials are based on the most recent Mortgage that was taken out on this home.
Original Mortgage
$322,700
Outstanding Balance
$144,638
Interest Rate
5.75%
Mortgage Type
Purchase Money Mortgage
Estimated Equity
$1,158,918
Purchase Details
Closed on
Oct 15, 1999
Sold by
Pannu Baljit S and Pannu Manjit K
Bought by
Singh Harminder and Flora Parmjit
Home Financials for this Owner
Home Financials are based on the most recent Mortgage that was taken out on this home.
Original Mortgage
$240,000
Interest Rate
7.86%
Purchase Details
Closed on
Aug 20, 1999
Sold by
Kumar Satvinder and Kumar Jasvinder
Bought by
Pannu Baljit S and Pannu Manjit K
Home Financials for this Owner
Home Financials are based on the most recent Mortgage that was taken out on this home.
Original Mortgage
$240,000
Interest Rate
7.86%
Create a Home Valuation Report for This Property
The Home Valuation Report is an in-depth analysis detailing your home's value as well as a comparison with similar homes in the area
Home Values in the Area
Average Home Value in this Area
Purchase History
| Date | Buyer | Sale Price | Title Company |
|---|---|---|---|
| Dulay Manjit S | $445,500 | Fidelity National Title Co | |
| Singh Harminder | $300,000 | Fidelity National Title | |
| Pannu Baljit S | $265,000 | Fidelity National Title Co |
Source: Public Records
Mortgage History
| Date | Status | Borrower | Loan Amount |
|---|---|---|---|
| Open | Dulay Manjit S | $322,700 | |
| Previous Owner | Singh Harminder | $240,000 | |
| Previous Owner | Pannu Baljit S | $212,000 |
Source: Public Records
Tax History Compared to Growth
Tax History
| Year | Tax Paid | Tax Assessment Tax Assessment Total Assessment is a certain percentage of the fair market value that is determined by local assessors to be the total taxable value of land and additions on the property. | Land | Improvement |
|---|---|---|---|---|
| 2025 | $9,291 | $633,371 | $190,082 | $443,289 |
| 2024 | $9,291 | $620,955 | $186,356 | $434,599 |
| 2023 | $8,989 | $608,779 | $182,702 | $426,077 |
| 2022 | $8,830 | $596,844 | $179,120 | $417,724 |
| 2021 | $8,634 | $585,145 | $175,609 | $409,536 |
| 2020 | $8,467 | $579,150 | $173,810 | $405,340 |
| 2019 | $8,547 | $567,793 | $170,401 | $397,392 |
| 2018 | $8,350 | $556,660 | $167,060 | $389,600 |
| 2017 | $8,152 | $545,746 | $163,785 | $381,961 |
| 2016 | $7,858 | $535,044 | $160,573 | $374,471 |
| 2015 | $7,709 | $527,007 | $158,161 | $368,846 |
| 2014 | $7,422 | $516,685 | $155,063 | $361,622 |
Source: Public Records
Map
Nearby Homes
- 32409 Elizabeth Way
- 32447 Pacific Grove Way
- 4639 Michelle Ct
- 4611 Carmen Way
- 4506 Birchwood Ct
- 32451 Regents Blvd
- 4532 Delores Dr
- 4633 Granada Way
- 4475 Queen Anne Dr
- 4201 Saturn Way
- 4214 Saturn Way
- 32945 Regents Blvd
- 4263 Queen Anne Dr
- 34102 Zaner Way
- 4243 Comet Cir
- 4231 Hanford St
- 4167 Sunflower Ct
- 4100 Aquarius Cir
- 33064 Compton Ct
- 4272 Warbler Loop
- 4720 Darlene Ct
- 4728 Darlene Ct
- 4723 Rose Way
- 4719 Rose Way
- 4732 Darlene Ct
- 4716 Darlene Ct
- 4727 Rose Way
- 4715 Rose Way
- 4725 Darlene Ct
- 4729 Darlene Ct
- 4736 Darlene Ct
- 4721 Darlene Ct
- 4731 Rose Way
- 4733 Darlene Ct
- 4717 Darlene Ct
- 4737 Darlene Ct
- 4735 Rose Way
- 4740 Darlene Ct
- 4709 Rose Way
- 4718 Rose Way