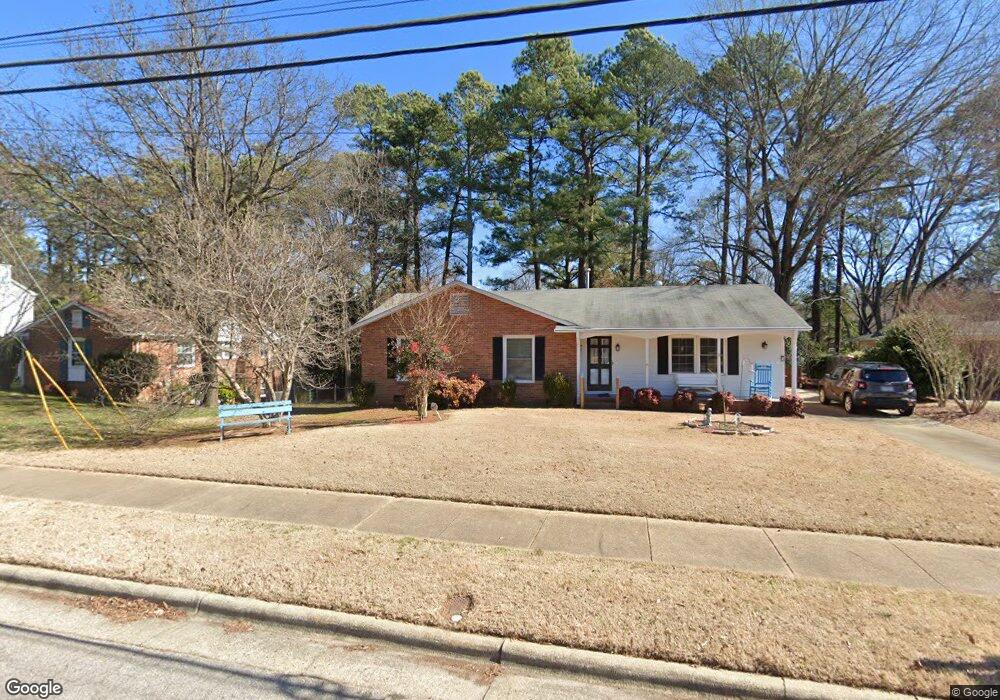
4724 Latimer Rd Raleigh, NC 27609
North Hills NeighborhoodEstimated Value: $547,734 - $652,000
3
Beds
2
Baths
1,580
Sq Ft
$374/Sq Ft
Est. Value
About This Home
This home is located at 4724 Latimer Rd, Raleigh, NC 27609 and is currently estimated at $590,434, approximately $373 per square foot. 4724 Latimer Rd is a home located in Wake County with nearby schools including Douglas Elementary, Carroll Middle, and Sanderson High School.
Ownership History
Date
Name
Owned For
Owner Type
Purchase Details
Closed on
Sep 30, 2022
Sold by
Battle Watkins Christopher and Bax Shannon
Bought by
Hiding Place Properties Llc
Current Estimated Value
Home Financials for this Owner
Home Financials are based on the most recent Mortgage that was taken out on this home.
Original Mortgage
$260,000
Outstanding Balance
$249,519
Interest Rate
5.66%
Mortgage Type
New Conventional
Estimated Equity
$340,915
Purchase Details
Closed on
Jan 21, 2022
Sold by
Watkins Frank H
Bought by
Watkins Christopher Battle and Watkins Shannon Baxley
Purchase Details
Closed on
Aug 29, 2011
Sold by
Griffin Craig A and Deason Tina Griffin
Bought by
Watkins Frank H and Watkins Linette
Home Financials for this Owner
Home Financials are based on the most recent Mortgage that was taken out on this home.
Original Mortgage
$172,000
Interest Rate
3.5%
Mortgage Type
New Conventional
Create a Home Valuation Report for This Property
The Home Valuation Report is an in-depth analysis detailing your home's value as well as a comparison with similar homes in the area
Home Values in the Area
Average Home Value in this Area
Purchase History
| Date | Buyer | Sale Price | Title Company |
|---|---|---|---|
| Hiding Place Properties Llc | -- | -- | |
| Hiding Place Properties Llc | -- | None Listed On Document | |
| Watkins Christopher Battle | $375,000 | None Listed On Document | |
| Watkins Frank H | $215,000 | None Available |
Source: Public Records
Mortgage History
| Date | Status | Borrower | Loan Amount |
|---|---|---|---|
| Open | Hiding Place Properties Llc | $260,000 | |
| Closed | Hiding Place Properties Llc | $260,000 | |
| Previous Owner | Watkins Frank H | $172,000 |
Source: Public Records
Tax History
| Year | Tax Paid | Tax Assessment Tax Assessment Total Assessment is a certain percentage of the fair market value that is determined by local assessors to be the total taxable value of land and additions on the property. | Land | Improvement |
|---|---|---|---|---|
| 2025 | $4,402 | $502,437 | $475,000 | $27,437 |
| 2024 | $4,384 | $502,437 | $475,000 | $27,437 |
| 2023 | $3,528 | $321,876 | $240,000 | $81,876 |
| 2022 | $3,279 | $321,876 | $240,000 | $81,876 |
| 2021 | $3,152 | $321,876 | $240,000 | $81,876 |
| 2020 | $3,095 | $321,876 | $240,000 | $81,876 |
| 2019 | $2,825 | $242,081 | $130,000 | $112,081 |
| 2018 | $2,665 | $242,081 | $130,000 | $112,081 |
| 2017 | $2,538 | $242,081 | $130,000 | $112,081 |
| 2016 | $2,486 | $242,081 | $130,000 | $112,081 |
| 2015 | $2,312 | $221,348 | $120,000 | $101,348 |
| 2014 | -- | $221,348 | $120,000 | $101,348 |
Source: Public Records
Map
Nearby Homes
- 4700 Stonehill Dr
- 621 Duke Dr
- 4921 Sweetbriar Dr
- 4212 Converse Dr
- 312 Compton Rd
- 4208 Redington Dr
- 405 Latimer Rd
- 4914 Lakemont Dr
- 4906 Tremont Dr
- 5025 Quail Hollow Dr
- 425 E Millbrook Rd
- 4308 Windsor Place
- 5080 Flint Ridge Place Unit 5080
- 5219 Knollwood Rd
- 4305 Windsor Place
- 5130 Flint Ridge Place Unit 5130
- 667 Pine Ridge Place
- 5021 Tall Pines Ct
- 635 Pine Ridge Place
- 677 Pine Ridge Place
- 4720 Latimer Rd
- 4735 Radcliff Rd
- 4801 Radcliff Rd
- 4804 Latimer Rd
- 4729 Radcliff Rd
- 4716 Latimer Rd
- 4805 Radcliff Rd
- 4715 Latimer Rd
- 521 Pinecroft Dr
- 4725 Radcliff Rd
- 4809 Radcliff Rd
- 4713 Latimer Rd
- 601 Yale St
- 4721 Radcliff Rd
- 611 Yale St
- 505 Pinecroft Dr
- 4809 Latimer Rd
- 508 Pinecroft Dr
- 4813 Radcliff Rd
- 4812 Latimer Rd
Your Personal Tour Guide
Ask me questions while you tour the home.