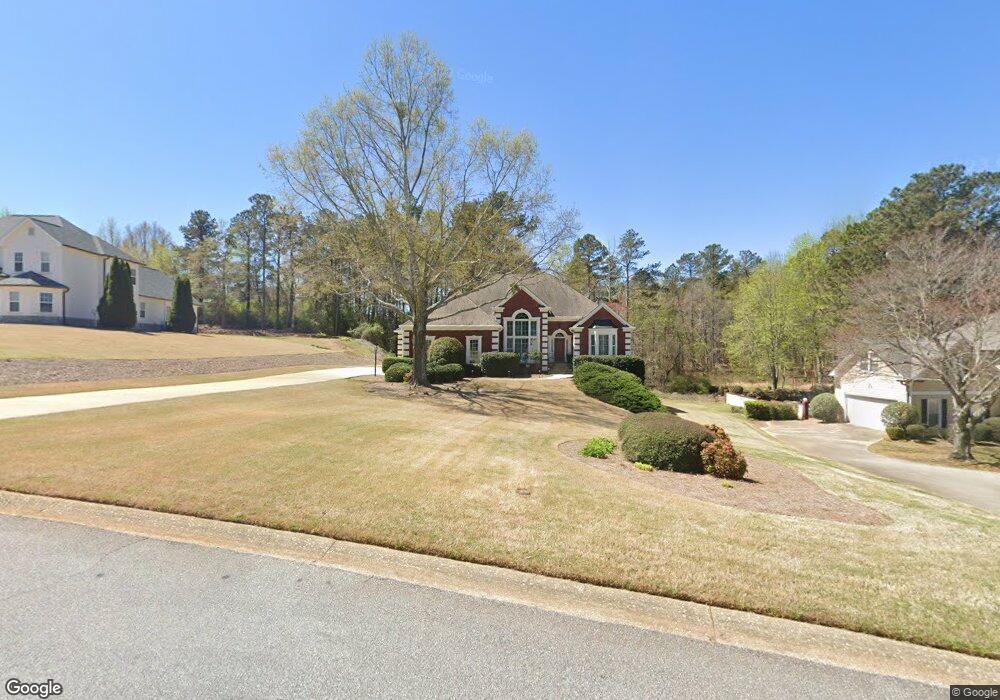
4724 Upper Berkshire Rd Flowery Branch, GA 30542
Royal Lakes NeighborhoodEstimated Value: $593,000 - $728,000
3
Beds
3
Baths
2,828
Sq Ft
$231/Sq Ft
Est. Value
About This Home
This home is located at 4724 Upper Berkshire Rd, Flowery Branch, GA 30542 and is currently estimated at $653,134, approximately $230 per square foot. 4724 Upper Berkshire Rd is a home located in Hall County with nearby schools including Chicopee Elementary School, South Hall Middle School, and Johnson High School.
Ownership History
Date
Name
Owned For
Owner Type
Purchase Details
Closed on
Jan 9, 2002
Sold by
Maney Steven R
Bought by
Maney Beth F
Current Estimated Value
Home Financials for this Owner
Home Financials are based on the most recent Mortgage that was taken out on this home.
Original Mortgage
$77,700
Outstanding Balance
$31,322
Interest Rate
6.85%
Mortgage Type
New Conventional
Estimated Equity
$621,812
Purchase Details
Closed on
Dec 4, 2001
Sold by
Maney Steven R
Bought by
Maney Beth S Farmer
Home Financials for this Owner
Home Financials are based on the most recent Mortgage that was taken out on this home.
Original Mortgage
$77,700
Outstanding Balance
$31,322
Interest Rate
6.85%
Mortgage Type
New Conventional
Estimated Equity
$621,812
Purchase Details
Closed on
Oct 24, 1997
Sold by
Olin Homes Inc
Bought by
Maney Steven R
Home Financials for this Owner
Home Financials are based on the most recent Mortgage that was taken out on this home.
Original Mortgage
$179,900
Interest Rate
7.39%
Mortgage Type
New Conventional
Purchase Details
Closed on
May 1, 1997
Create a Home Valuation Report for This Property
The Home Valuation Report is an in-depth analysis detailing your home's value as well as a comparison with similar homes in the area
Home Values in the Area
Average Home Value in this Area
Purchase History
| Date | Buyer | Sale Price | Title Company |
|---|---|---|---|
| Maney Beth F | $1,000 | -- | |
| Maney Beth S Farmer | -- | -- | |
| Maney Steven R | $224,900 | -- | |
| -- | $33,500 | -- |
Source: Public Records
Mortgage History
| Date | Status | Borrower | Loan Amount |
|---|---|---|---|
| Open | Maney Beth F | $77,700 | |
| Previous Owner | Maney Steven R | $179,900 |
Source: Public Records
Tax History Compared to Growth
Tax History
| Year | Tax Paid | Tax Assessment Tax Assessment Total Assessment is a certain percentage of the fair market value that is determined by local assessors to be the total taxable value of land and additions on the property. | Land | Improvement |
|---|---|---|---|---|
| 2024 | $5,828 | $231,880 | $36,440 | $195,440 |
| 2023 | $5,696 | $242,280 | $33,400 | $208,880 |
| 2022 | $5,851 | $223,440 | $36,440 | $187,000 |
| 2021 | $5,047 | $188,640 | $27,920 | $160,720 |
| 2020 | $5,194 | $188,720 | $27,920 | $160,800 |
| 2019 | $4,927 | $177,280 | $23,200 | $154,080 |
| 2018 | $4,969 | $173,080 | $20,480 | $152,600 |
| 2017 | $4,118 | $144,600 | $11,600 | $133,000 |
| 2016 | $4,020 | $144,600 | $11,600 | $133,000 |
| 2015 | $3,516 | $125,192 | $9,400 | $115,792 |
| 2014 | $3,516 | $125,192 | $9,400 | $115,792 |
Source: Public Records
Map
Nearby Homes
- 4708 Upper Berkshire Rd Unit 39
- 4610 Blakeford Ct
- 4743 Amsterdam Ln
- 4835 Upper Berkshire Rd
- 4838 Netherlands Place
- 3929 Perry Ln
- 4434 Oxburgh Park
- 4439 Oxburgh Park
- 4478 Longmead Rd
- 4446 Union Church Rd
- 4315 Marble Arch Way
- 5061 Pointer Ridge
- 5055 Pointer Ridge
- 4559 Winder Hwy
- 0 Marble Arch Way
- 4621 Chartwell Chase Ct
- 4860 Wildlife Way
- 4728 Upper Berkshire Rd
- 4705 Bedford Glen
- 4709 Bedford Glen
- 4732 Upper Berkshire Rd
- 4707 Saxon Ridge
- 4719 Upper Berkshire Rd
- 0 Saxon Ridge
- 4708 Saxon Ridge
- 4736 Upper Berkshire Rd
- 4713 Bedford Glen
- 0 Bedford Glenn
- 4715 Upper Berkshire Rd
- 0 Bedford Glen Unit 9063108
- 0 Bedford Glen Unit 3244844
- 4710 Bedford Glen
- 4711 Saxon Ridge
- 4737 Upper Berkshire Rd
- 4740 Upper Berkshire Rd
- 4715 Saxon Ridge
- 4718 Bedford Glen