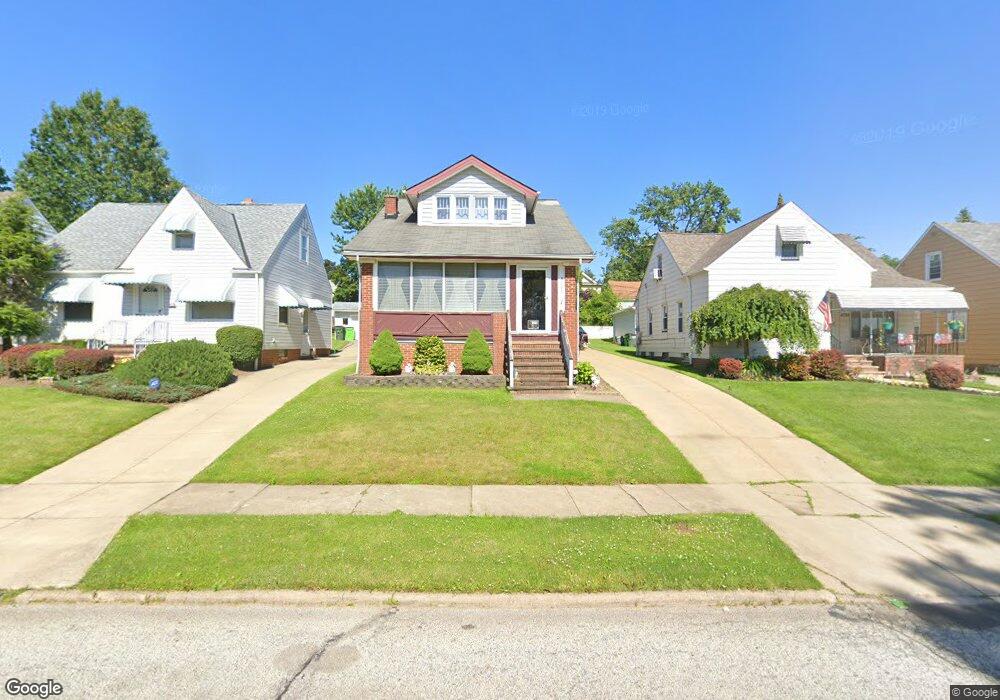
4725 E 88th St Cleveland, OH 44125
Estimated Value: $104,138 - $137,000
3
Beds
2
Baths
1,080
Sq Ft
$113/Sq Ft
Est. Value
About This Home
This home is located at 4725 E 88th St, Cleveland, OH 44125 and is currently estimated at $121,535, approximately $112 per square foot. 4725 E 88th St is a home located in Cuyahoga County with nearby schools including Garfield Heights High School, North Shore High School, and Holy Name Elementary School.
Ownership History
Date
Name
Owned For
Owner Type
Purchase Details
Closed on
Aug 21, 1998
Sold by
Eskut Michael D and Eskut Darlene K
Bought by
Hardy William G and Hardy Kathy L
Current Estimated Value
Home Financials for this Owner
Home Financials are based on the most recent Mortgage that was taken out on this home.
Original Mortgage
$65,286
Outstanding Balance
$13,703
Interest Rate
6.99%
Mortgage Type
FHA
Estimated Equity
$107,832
Purchase Details
Closed on
Nov 20, 1985
Sold by
Grace Bergbacher
Bought by
Eskut Michael D and Eskut Darlene K
Purchase Details
Closed on
May 19, 1982
Sold by
Bergbacher Harold W and Bergbacher Grace
Bought by
Grace Bergbacher
Purchase Details
Closed on
Mar 13, 1979
Sold by
Burgbacher Harold W
Bought by
Bergbacher Harold W and Bergbacher Grace
Purchase Details
Closed on
Jan 1, 1975
Bought by
Kadras Paul and Kadras Sandy
Create a Home Valuation Report for This Property
The Home Valuation Report is an in-depth analysis detailing your home's value as well as a comparison with similar homes in the area
Home Values in the Area
Average Home Value in this Area
Purchase History
| Date | Buyer | Sale Price | Title Company |
|---|---|---|---|
| Hardy William G | $64,900 | Guardian Title | |
| Eskut Michael D | -- | -- | |
| Grace Bergbacher | -- | -- | |
| Bergbacher Harold W | $24,000 | -- | |
| Burgbacher Harold W | $23,900 | -- | |
| Kadras Paul | -- | -- |
Source: Public Records
Mortgage History
| Date | Status | Borrower | Loan Amount |
|---|---|---|---|
| Open | Hardy William G | $65,286 |
Source: Public Records
Tax History
| Year | Tax Paid | Tax Assessment Tax Assessment Total Assessment is a certain percentage of the fair market value that is determined by local assessors to be the total taxable value of land and additions on the property. | Land | Improvement |
|---|---|---|---|---|
| 2024 | $4,197 | $40,180 | $8,015 | $32,165 |
| 2023 | $2,966 | $25,940 | $5,460 | $20,480 |
| 2022 | $2,925 | $25,940 | $5,460 | $20,480 |
| 2021 | $3,091 | $25,940 | $5,460 | $20,480 |
| 2020 | $2,659 | $20,760 | $4,380 | $16,380 |
| 2019 | $2,636 | $59,300 | $12,500 | $46,800 |
| 2018 | $2,743 | $20,760 | $4,380 | $16,380 |
| 2017 | $2,555 | $18,800 | $3,470 | $15,330 |
| 2016 | $2,592 | $18,800 | $3,470 | $15,330 |
| 2015 | $2,853 | $18,800 | $3,470 | $15,330 |
| 2014 | $2,853 | $22,930 | $4,240 | $18,690 |
Source: Public Records
Map
Nearby Homes
- 4690 E 90th St
- 4658 E 88th St
- 4748 E 94th St
- 4643 E 90th St
- 4723 E 94th St
- 9435 Dorothy Ave
- 8304 Garfield Blvd
- 8220 Garfield Blvd
- 4839 E 94th St
- 4863 E 93rd St
- 4864 E 94th St
- 8322 Bancroft Ave
- 8215 Crudele Dr
- 4768 Burleigh Rd
- 9722 Robinson Ave
- 4904 Donovan Dr
- 4550 Effie Rd
- 8606 Vineyard Ave
- 8119 Bancroft Ave
- 0 Grand Division Ave Unit 5144783
Your Personal Tour Guide
Ask me questions while you tour the home.