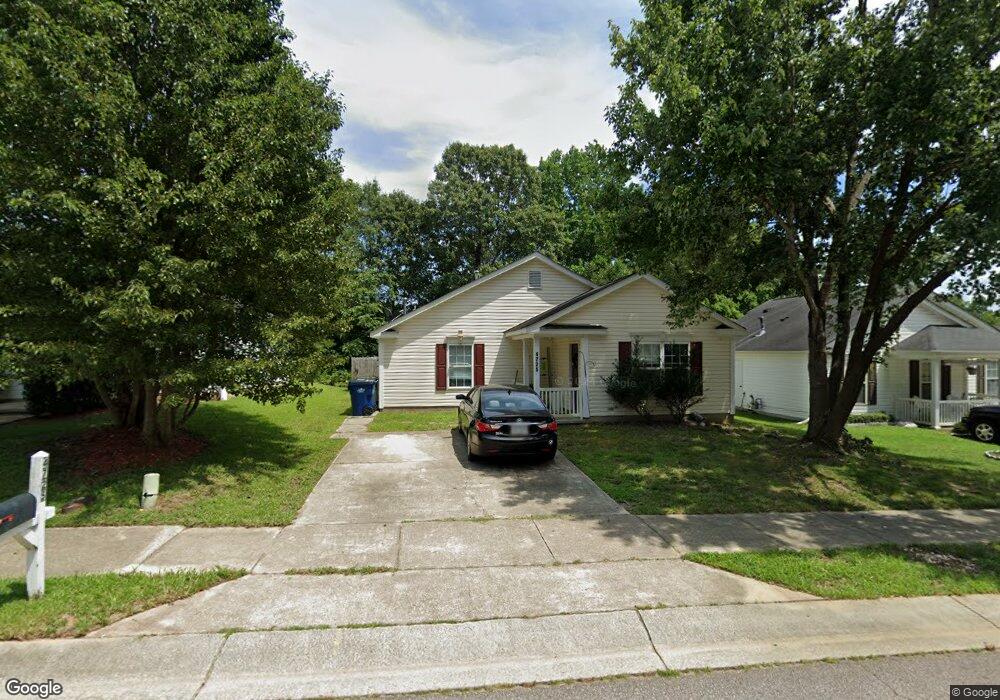
4725 Silverdene St Raleigh, NC 27616
Northeast Raleigh NeighborhoodEstimated Value: $297,000 - $318,944
4
Beds
2
Baths
1,534
Sq Ft
$202/Sq Ft
Est. Value
About This Home
This home is located at 4725 Silverdene St, Raleigh, NC 27616 and is currently estimated at $309,736, approximately $201 per square foot. 4725 Silverdene St is a home located in Wake County with nearby schools including Sanford Creek Elementary School, River Bend Middle, and Rolesville High School.
Ownership History
Date
Name
Owned For
Owner Type
Purchase Details
Closed on
Feb 15, 2017
Sold by
Garcia Enos and Negron Yesenia
Bought by
Linares Brain E and Linares Melanie M
Current Estimated Value
Home Financials for this Owner
Home Financials are based on the most recent Mortgage that was taken out on this home.
Original Mortgage
$155,200
Outstanding Balance
$128,499
Interest Rate
4.2%
Mortgage Type
New Conventional
Estimated Equity
$181,237
Purchase Details
Closed on
May 30, 2014
Sold by
Rizk Kamal and Rizk Vivian
Bought by
Garcia Enos and Negron Yesenia
Home Financials for this Owner
Home Financials are based on the most recent Mortgage that was taken out on this home.
Original Mortgage
$133,000
Interest Rate
4.32%
Mortgage Type
VA
Purchase Details
Closed on
Mar 29, 2001
Sold by
Beazer Homes Corp
Bought by
Rizk Kamal and Rizk Vivian
Home Financials for this Owner
Home Financials are based on the most recent Mortgage that was taken out on this home.
Original Mortgage
$110,000
Interest Rate
7.02%
Create a Home Valuation Report for This Property
The Home Valuation Report is an in-depth analysis detailing your home's value as well as a comparison with similar homes in the area
Home Values in the Area
Average Home Value in this Area
Purchase History
| Date | Buyer | Sale Price | Title Company |
|---|---|---|---|
| Linares Brain E | $160,000 | None Available | |
| Garcia Enos | $138,000 | None Available | |
| Rizk Kamal | $123,000 | -- |
Source: Public Records
Mortgage History
| Date | Status | Borrower | Loan Amount |
|---|---|---|---|
| Open | Linares Brain E | $155,200 | |
| Previous Owner | Garcia Enos | $133,000 | |
| Previous Owner | Rizk Kamal | $110,000 |
Source: Public Records
Tax History
| Year | Tax Paid | Tax Assessment Tax Assessment Total Assessment is a certain percentage of the fair market value that is determined by local assessors to be the total taxable value of land and additions on the property. | Land | Improvement |
|---|---|---|---|---|
| 2025 | $2,917 | $332,166 | $110,000 | $222,166 |
| 2024 | $2,905 | $332,166 | $110,000 | $222,166 |
Source: Public Records
Map
Nearby Homes
- 5009 Silverdene St
- 5004 Silverdene St
- 5012 Silverdene St
- 4715 Jelynn St
- 5016 Kyle Dr
- 5015 Croftwood Dr
- 4821 Heathshire Dr
- 5009 Marathon Ln
- 4809 Kaycee Ct
- 5208 Windmere Chase Dr
- 4416 Brintons Cottage St
- 5315 Eagles Landing Dr
- 4416 Walker Hallow St
- 4508 Brintons Cottage St
- 5405 Eagles Landing Dr
- 4249 Saubranch Hill St
- 4828 Mocha Ln
- 4701 Tommans Trail
- 4737 Waterford Cove Dr
- 4721 Mocha Ln
- 4729 Silverdene St
- 4721 Silverdene St
- 4717 Silverdene St
- 4801 Silverdene St
- 5508 Wilhagan Ct
- 5504 Wilhagan Ct
- 4709 Silverdene St
- 4817 Silverdene St
- 5516 Wilhagan Ct
- 4724 Silverdene St
- 4728 Silverdene St
- 5520 Wilhagan Ct
- 4732 Silverdene St
- 4720 Silverdene St
- 4705 Silverdene St
- 5500 Wilhagan Ct
- 4821 Silverdene St
- 4716 Silverdene St
- 4800 Silverdene St
- 5528 Wilhagan Ct
Your Personal Tour Guide
Ask me questions while you tour the home.