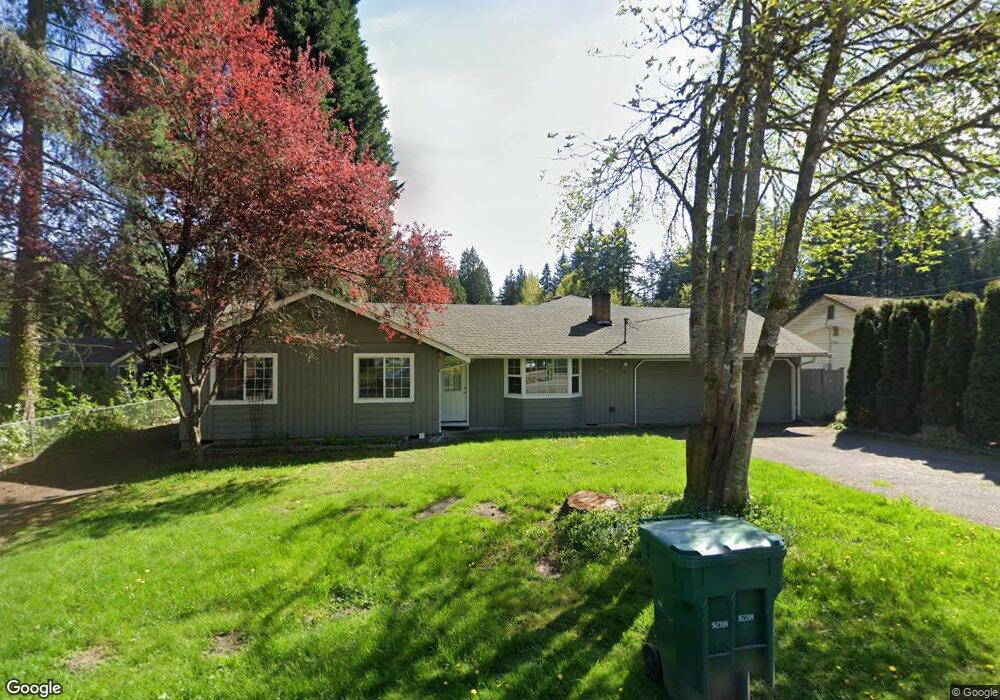
4726 224th St SE Bothell, WA 98021
North Creek NeighborhoodEstimated Value: $908,000 - $1,143,000
3
Beds
3
Baths
1,860
Sq Ft
$546/Sq Ft
Est. Value
About This Home
This home is located at 4726 224th St SE, Bothell, WA 98021 and is currently estimated at $1,015,897, approximately $546 per square foot. 4726 224th St SE is a home located in Snohomish County with nearby schools including Kokanee Elementary School, Leota Middle School, and North Creek High School.
Ownership History
Date
Name
Owned For
Owner Type
Purchase Details
Closed on
Jul 14, 2020
Sold by
Smith Myron and Smith Myron
Bought by
Turnidge Melissa and Turnidge Jason
Current Estimated Value
Home Financials for this Owner
Home Financials are based on the most recent Mortgage that was taken out on this home.
Original Mortgage
$383,300
Outstanding Balance
$340,516
Interest Rate
3.2%
Mortgage Type
New Conventional
Estimated Equity
$675,381
Purchase Details
Closed on
Mar 28, 2006
Sold by
Williams Dana M
Bought by
Smith Myron and Williams Dana M
Purchase Details
Closed on
Aug 8, 2003
Sold by
Williams Robert and Williams Dana
Bought by
Williams Dana
Home Financials for this Owner
Home Financials are based on the most recent Mortgage that was taken out on this home.
Original Mortgage
$125,000
Interest Rate
4.55%
Mortgage Type
Purchase Money Mortgage
Create a Home Valuation Report for This Property
The Home Valuation Report is an in-depth analysis detailing your home's value as well as a comparison with similar homes in the area
Home Values in the Area
Average Home Value in this Area
Purchase History
| Date | Buyer | Sale Price | Title Company |
|---|---|---|---|
| Turnidge Melissa | $583,300 | Chicago Title | |
| Smith Myron | $56,179 | Accommodation | |
| Williams Dana | $11,235 | Stewart Title |
Source: Public Records
Mortgage History
| Date | Status | Borrower | Loan Amount |
|---|---|---|---|
| Open | Turnidge Melissa | $383,300 | |
| Previous Owner | Williams Dana | $125,000 |
Source: Public Records
Tax History
| Year | Tax Paid | Tax Assessment Tax Assessment Total Assessment is a certain percentage of the fair market value that is determined by local assessors to be the total taxable value of land and additions on the property. | Land | Improvement |
|---|---|---|---|---|
| 2025 | $7,050 | $904,300 | $625,000 | $279,300 |
| 2024 | $7,050 | $798,400 | $519,000 | $279,400 |
| 2023 | $7,725 | $978,000 | $655,000 | $323,000 |
| 2022 | $7,092 | $713,100 | $435,000 | $278,100 |
| 2020 | $5,645 | $534,000 | $354,000 | $180,000 |
| 2019 | $5,159 | $497,100 | $320,000 | $177,100 |
| 2018 | $4,865 | $436,600 | $275,000 | $161,600 |
| 2017 | $3,951 | $361,100 | $215,000 | $146,100 |
| 2016 | $3,768 | $328,300 | $185,000 | $143,300 |
Source: Public Records
Map
Nearby Homes
- 22222 49th Ave SE
- 4214 223rd Place SE
- 4215 228th St SE
- 4132 220th St SE
- 22912 43rd Dr SE
- 4118 220th Place SE
- 4216 220th St SE
- 22919 41st Dr SE
- 4219 220th St SE
- 4426 216th Place SE
- 4215 220th St SE
- 21903 41st Ave SE
- 4021 220th St SE
- 4103 220th St SE
- 3931 221st Place SE
- 21417 43rd Dr SE Unit 19
- 22629 57th Ave SE
- 4026 215th Place SE
- 21708 57th Ave SE
- 5404 215th St SE
- 4720 224th St SE
- 4804 224th St SE
- 4725 224th St SE
- 4708 224th St SE
- 4803 224th St SE
- 4816 224th St SE
- 4709 224th St SE
- 4822 224th St SE
- 4704 224th St SE
- 4707 224th St SE
- 4815 224th St SE
- 22508 49th Ave SE
- 22308 49th Ave SE
- 4621 224th St SE
- 4808 224th St SE
- 4706 224th St SE
- 22509 45th Ave SE
- 22401 49th Ave SE
- 22524 49th Ave SE
- 22206 49th Ave SE
Your Personal Tour Guide
Ask me questions while you tour the home.