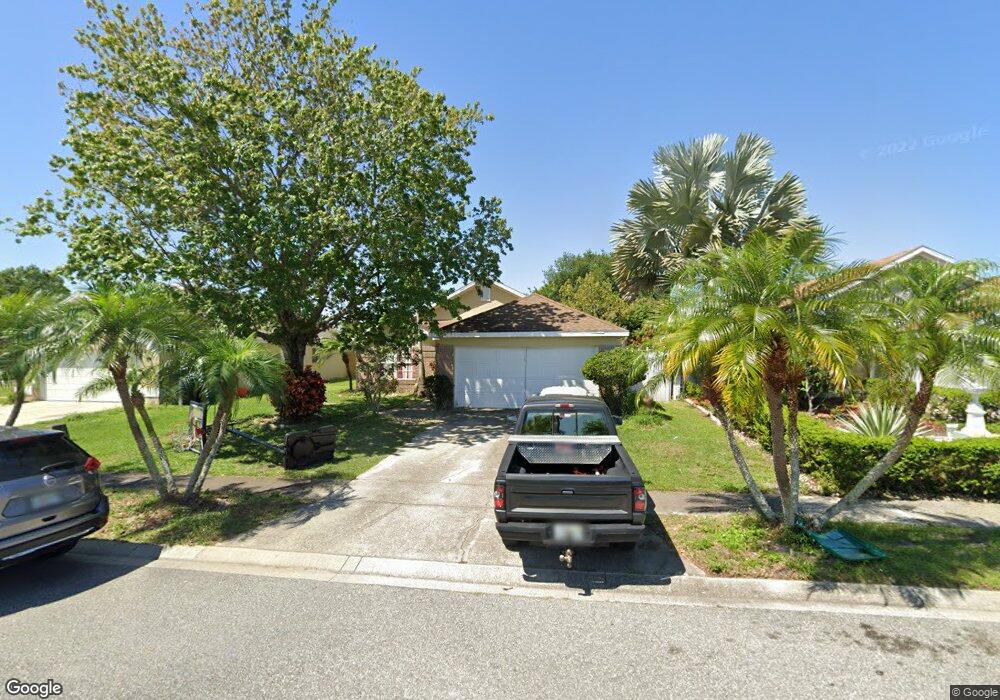
4726 Fort Bravo Ct Orlando, FL 32822
Chickasaw NeighborhoodEstimated Value: $375,161 - $386,000
3
Beds
2
Baths
1,227
Sq Ft
$308/Sq Ft
Est. Value
About This Home
This home is located at 4726 Fort Bravo Ct, Orlando, FL 32822 and is currently estimated at $378,290, approximately $308 per square foot. 4726 Fort Bravo Ct is a home located in Orange County with nearby schools including Three Points Elementary School, Odyssey Middle School, and Colonial High School.
Ownership History
Date
Name
Owned For
Owner Type
Purchase Details
Closed on
Feb 18, 2009
Sold by
Hsbc Bank Usa National Association
Bought by
Campos Sergio and Campos Magda
Current Estimated Value
Home Financials for this Owner
Home Financials are based on the most recent Mortgage that was taken out on this home.
Original Mortgage
$127,546
Interest Rate
4.86%
Mortgage Type
FHA
Purchase Details
Closed on
Nov 14, 2008
Sold by
Couto Uelton Joatan and Couto Daniela
Bought by
Hsbc Bank Usa National Association
Purchase Details
Closed on
Sep 15, 2005
Sold by
Theodore Rickey S and Theodore Allison
Bought by
Couto Uelton Joatan and Couto Daniela
Home Financials for this Owner
Home Financials are based on the most recent Mortgage that was taken out on this home.
Original Mortgage
$213,600
Interest Rate
9.15%
Mortgage Type
Purchase Money Mortgage
Create a Home Valuation Report for This Property
The Home Valuation Report is an in-depth analysis detailing your home's value as well as a comparison with similar homes in the area
Home Values in the Area
Average Home Value in this Area
Purchase History
| Date | Buyer | Sale Price | Title Company |
|---|---|---|---|
| Campos Sergio | $128,000 | Watson Title Ins Inc | |
| Hsbc Bank Usa National Association | $81,000 | None Available | |
| Couto Uelton Joatan | $267,000 | Chelsea Title Company |
Source: Public Records
Mortgage History
| Date | Status | Borrower | Loan Amount |
|---|---|---|---|
| Previous Owner | Campos Sergio | $127,546 | |
| Previous Owner | Couto Uelton Joatan | $213,600 |
Source: Public Records
Tax History Compared to Growth
Tax History
| Year | Tax Paid | Tax Assessment Tax Assessment Total Assessment is a certain percentage of the fair market value that is determined by local assessors to be the total taxable value of land and additions on the property. | Land | Improvement |
|---|---|---|---|---|
| 2025 | $4,559 | $309,520 | $85,000 | $224,520 |
| 2024 | $4,269 | $300,040 | $85,000 | $215,040 |
| 2023 | $4,269 | $292,939 | $95,000 | $197,939 |
| 2022 | $4,015 | $240,515 | $70,000 | $170,515 |
| 2021 | $3,668 | $207,924 | $55,000 | $152,924 |
| 2020 | $3,414 | $199,539 | $45,000 | $154,539 |
| 2019 | $3,467 | $201,154 | $45,000 | $156,154 |
| 2018 | $3,196 | $179,352 | $38,000 | $141,352 |
| 2017 | $2,957 | $163,867 | $25,000 | $138,867 |
| 2016 | $2,765 | $150,757 | $25,000 | $125,757 |
| 2015 | $2,674 | $146,119 | $25,000 | $121,119 |
| 2014 | $2,415 | $119,846 | $25,000 | $94,846 |
Source: Public Records
Map
Nearby Homes
- 8312 Fort Clinch Ave
- 8353 Fort Clinch Ave
- 8241 Hatteras Rd Unit 1148
- 8507 Fort Thomas Way
- 8600 Fort Shea Ave
- 9176 Fort Jefferson Blvd
- 8207 Palm Harbor Way Unit 1185
- 8078 Palm Harbor Way Unit 1268
- 9157 Fort Jefferson Blvd
- 8013 Hatteras Rd Unit 1126
- 5417 Nerissa Ln Unit 1309
- 8107 Charlin Pkwy
- 8448 Dimare Dr
- 8718 Fort Shea Ave
- 5460 Marty Rd
- 5477 Marty Rd Unit 1345
- 4425 Crossen Dr
- 5375 R D Ave Unit 1092
- 8445 Quisqualis Dr
- 8762 Fort Shea Ave
- 4720 Fort Bravo Ct
- 4732 Fort Bravo Ct
- 4714 Fort Bravo Ct
- 4719 Fort Knox Ct
- 4707 Fort Knox Ct
- 4725 Fort Knox Ct
- 4708 Fort Bravo Ct
- 4733 Fort Bravo Ct
- 4727 Fort Bravo Ct
- 4805 Fort Apache Ct
- 4806 Fort Dodge St
- 4702 Fort Bravo Ct
- 4721 Fort Bravo Ct
- 4701 Fort Knox Ct
- 4811 Fort Apache Ct
- 4715 Fort Bravo Ct
- 4812 Fort Dodge St
- 4709 Fort Bravo Ct
- 4703 Fort Bravo Ct
- 4807 Fort Dodge St