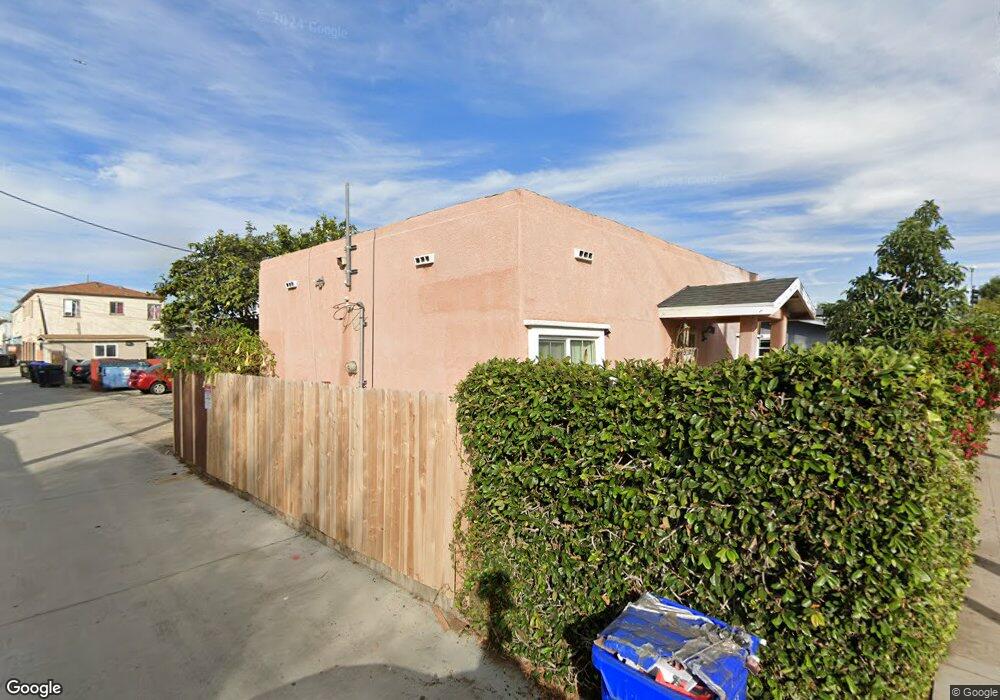
4726 Wightman St San Diego, CA 92105
Fairmount Village NeighborhoodEstimated Value: $506,000 - $584,000
2
Beds
1
Bath
616
Sq Ft
$887/Sq Ft
Est. Value
About This Home
This home is located at 4726 Wightman St, San Diego, CA 92105 and is currently estimated at $546,251, approximately $886 per square foot. 4726 Wightman St is a home located in San Diego County with nearby schools including Rosa Parks Elementary School, Clark Middle School, and Herbert Hoover High School.
Ownership History
Date
Name
Owned For
Owner Type
Purchase Details
Closed on
Aug 5, 1996
Sold by
Klein Eric
Bought by
Silva Jose
Current Estimated Value
Home Financials for this Owner
Home Financials are based on the most recent Mortgage that was taken out on this home.
Original Mortgage
$49,400
Outstanding Balance
$3,120
Interest Rate
5.87%
Estimated Equity
$543,131
Purchase Details
Closed on
Jul 13, 1996
Sold by
Hud
Bought by
Klein Eric
Home Financials for this Owner
Home Financials are based on the most recent Mortgage that was taken out on this home.
Original Mortgage
$49,400
Outstanding Balance
$3,120
Interest Rate
5.87%
Estimated Equity
$543,131
Purchase Details
Closed on
Mar 7, 1996
Sold by
California Housing Finance Agency
Bought by
Hud
Purchase Details
Closed on
Mar 5, 1996
Sold by
Barboza Louis P and Barboza Nancy A
Bought by
California Housing Finance Agency
Purchase Details
Closed on
May 18, 1989
Purchase Details
Closed on
Aug 29, 1986
Create a Home Valuation Report for This Property
The Home Valuation Report is an in-depth analysis detailing your home's value as well as a comparison with similar homes in the area
Home Values in the Area
Average Home Value in this Area
Purchase History
| Date | Buyer | Sale Price | Title Company |
|---|---|---|---|
| Silva Jose | $52,000 | California Coast Title | |
| Klein Eric | $29,500 | California Coast Title | |
| Hud | -- | Northern Counties Title Co | |
| California Housing Finance Agency | $68,637 | Benefit Land Title Company | |
| -- | $65,500 | -- | |
| -- | $60,000 | -- |
Source: Public Records
Mortgage History
| Date | Status | Borrower | Loan Amount |
|---|---|---|---|
| Open | Silva Jose | $49,400 |
Source: Public Records
Tax History Compared to Growth
Tax History
| Year | Tax Paid | Tax Assessment Tax Assessment Total Assessment is a certain percentage of the fair market value that is determined by local assessors to be the total taxable value of land and additions on the property. | Land | Improvement |
|---|---|---|---|---|
| 2025 | $969 | $84,661 | $48,844 | $35,817 |
| 2024 | $969 | $83,002 | $47,887 | $35,115 |
| 2023 | $945 | $81,376 | $46,949 | $34,427 |
| 2022 | $918 | $79,781 | $46,029 | $33,752 |
| 2021 | $910 | $78,218 | $45,127 | $33,091 |
| 2020 | $899 | $77,417 | $44,665 | $32,752 |
| 2019 | $882 | $75,900 | $43,790 | $32,110 |
| 2018 | $824 | $74,413 | $42,932 | $31,481 |
| 2017 | $803 | $72,955 | $42,091 | $30,864 |
| 2016 | $787 | $71,525 | $41,266 | $30,259 |
| 2015 | $775 | $70,452 | $40,647 | $29,805 |
| 2014 | $762 | $69,073 | $39,851 | $29,222 |
Source: Public Records
Map
Nearby Homes
- 3842 46th St
- 4074 48th St Unit 7
- 3733 Chamoune Ave
- 4085 48th St Unit 5
- 4888 Auburn Dr
- 4091 48th St
- 4863 Polk Ave
- 4837 Castle Ave
- 4129-31 Chamoune Ave
- 3863 Highland Ave Unit 4
- 4135 Chamoune Ave
- 4792 Dwight St
- 4787 Dwight St
- 4175 Chamoune Ave
- 4222 Menlo Ave Unit 9
- 4222 Menlo Ave Unit 17
- 4230 48th St Unit 2
- 4230 48th St Unit 9
- 4230 48th St Unit 5
- 3518-3520 Euclid Ave E
- 3810 Euclid Ave Unit 16
- 3804 Euclid Ave
- 4718 Wightman St
- 3820 Euclid Ave
- 3815 47th St
- 3796 Euclid Ave
- 3813 47th St
- 3813 47th St Unit 15
- 3807 47th St
- 3819 47th St
- 3819 47th St Unit 7
- 3819 47th St Unit 5
- 3819 47th St Unit 4
- 3819 47th St Unit 3
- 3819 47th St Unit 2
- 3819 47th St Unit 1
- 4717 Wightman St
- 3826 Euclid Ave
- 3784 Euclid Ave
- 3784 Euclid Ave Unit 90